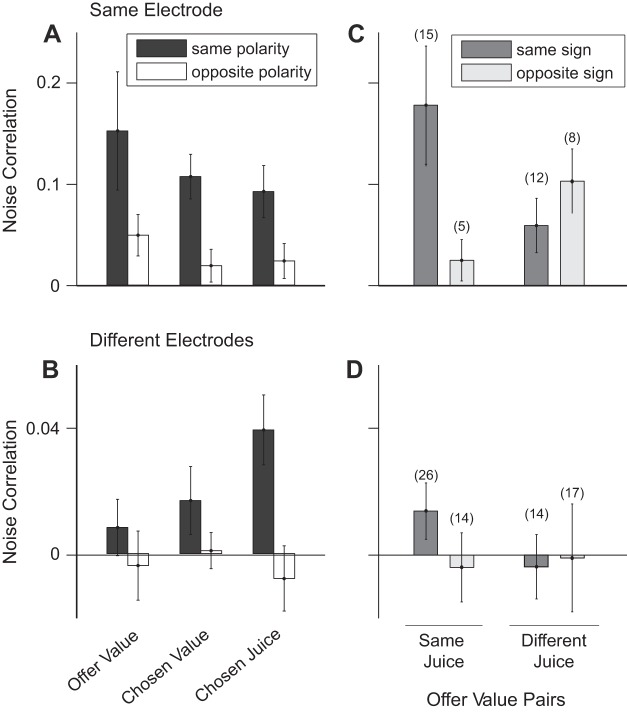
Fig. 6.
Noise correlations depend on the polarity of the two cells. A and C: cell pairs from the same electrode. B and D: cell pairs from different electrodes. A and B: noise correlations between cells in the same group (offer value, chosen value, and chosen juice). Black (white) bars refer to pairs of cells with the same (opposite) polarity. For each cell group, rnoise was higher when the two neurons had the same polarity. This observation was true both at short and long distance. C and D: noise correlations between pairs of offer value cells. Pairs were divided in 8 pools depending on whether the two cells were recorded from the same or different electrode (top, bottom), on whether the two neurons encoded the same juice or different juices (left, right), and on whether the sign of the encoding for the two cells was the same or different (dark gray, light gray). In general, rnoise was highest when two cells encoded the same juice with the same sign. Values of rnoise show the average across all time windows. Nos. in parentheses indicate the no. of neurons in each pool. All error bars indicate SE.

