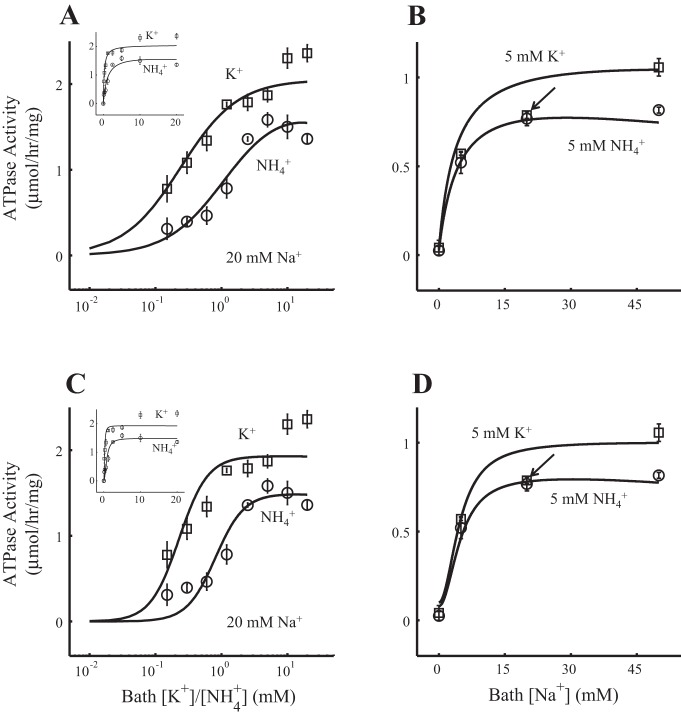
Fig. 2.
H+(Na+)-K+(NH4+)-ATPase model fit to the experimental data. Each flux is multiplied by the corresponding Jmaxexp shown in Table 4. A and B: the 1H+(1Na+):1K+(1NH4+)-per-ATP stoichiometry model. C and D: the 2H+(2Na+):2K+(2NH4+)-per-ATP stoichiometry model. A and C: ATPase activity as a function of bath K+ concentration ([K+]; squares, Experiment 1 in Table 1) or NH4+ concentration ([NH4+]; circles, Experiment 2 in Table 1), both with bath Na+ concentration ([Na+]) fixed to 20 mM. For a better appreciation of the fittings, the x-axis is presented in the log10 scale and does not include the data corresponding to [K+] and [NH4+] equal to zero. The fittings in the linear scale are shown in the top left corner and include the data corresponding to [K+] and [NH4+] equal to zero. B and D: ATPase activity as a function of bath [Na+] with [K+] fixed to 5 mM (squares, Experiment 3 in Table 1) or [NH4+] fixed to 5 mM (circles, Experiment 4 in Table 1). The arrow identifies the square that corresponds to [Na+] at 20 mM (see results). The R2 value of the model fit to the experimental data was 0.95 for the 1H+(1Na+)-1K+(1NH4+)-ATPase model and 0.93 for the 2H+(2Na+)-2K+(2NH4+)-ATPase model. The resulting H+-to-K+ net flux ratio under the conditions in H+-to-K+ net flux ratio in Table 1 was 0.0099 for the 1H+(1Na+)-1K+(1NH4+)-ATPase model and 0.011 for the 2H+(2Na+)-2K+(2NH4+)-ATPase model.

