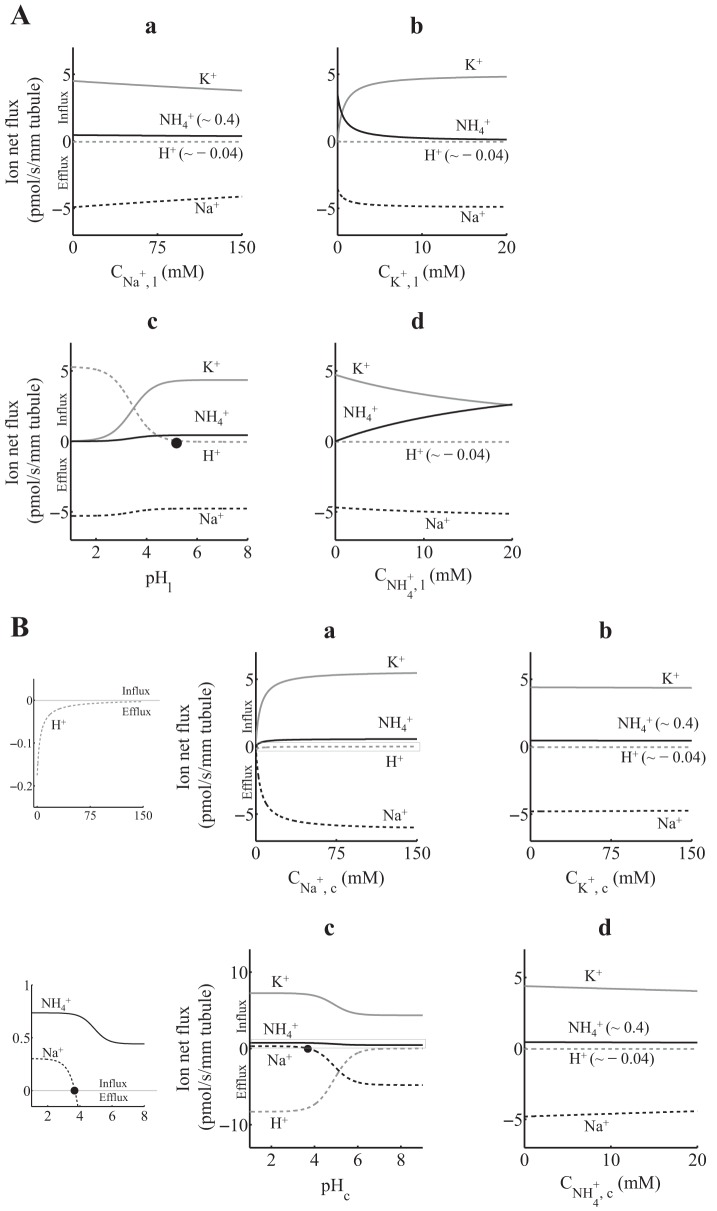
Fig. 3.
A: 1H+(1Na+)-1K+(1NH4+)-ATPase ion net flux as a function of luminal ion concentration, assuming that the total density of protein ET is 1 pmol/mm tubule. When not varied, lumen and cytosol [Na+], [K+], [NH4+], and pH were set as in Table 1 (Net flux simulation). Positive fluxes are into the cell, and negative fluxes are out of the cell. H+ flux reverses at a luminal pH (pHl) of ∼5.6 (solid circle). B: 1H+(1Na+)-1K+(1NH4+)-ATPase ion net flux as a function of cytosolic ion concentration, assuming that the total density of protein ET is 1 pmol/mm tubule. When not varied, lumen and cytosol [Na+], [K+], [NH4+], and pH were set as in Table 1 (Net flux simulation). Graphs in a and c were zoomed to appreciate small-scale ion net fluxes (left). Positive fluxes are into the cell, and negative fluxes are out of the cell. Na+ flux reverses at a cytosolic pH (pHc) of ∼3.7 (solid circle).

