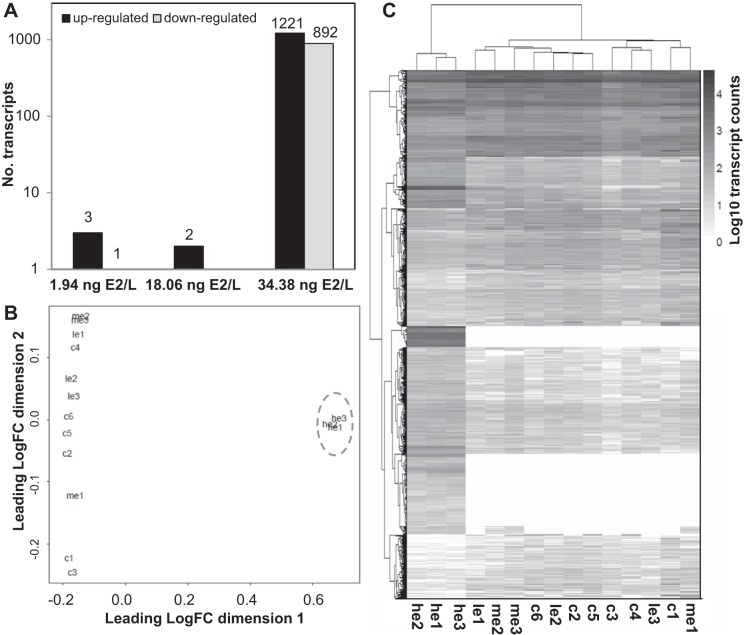
Fig. 1.
Differentially expressed transcripts following exposure to 17β-estradiol (E2) in the liver of mature male brown trout. Multiple transcripts are included for each gene annotation, which potentially reflect the presence of different isoforms as well as redundant fragments within the list of differentially expressed transcripts. A: number of upregulated and downregulated transcripts in each treatment group calculated with EdgeR [false discovery rate (FDR) <0.05]. B: multidimensional scaling plot illustrating the very significant effect of exposure to 34.4 ng E2/l on the hepatic transcriptome of male brown trout (presented within the blue circle, for visualization purposes) compared with all other groups, based on the expression of all differentially regulated transcripts. Individual fish are represented by the following codes: c1, c2, c3 c4, c5, and c6 represent the control individuals; le1, le2, and le3 represent individuals exposed to 1.9 ng E2/l; me1, me2, and me3 represent individuals exposed to 18.1 ng E2/l; he1, he2, and he3 represent individuals exposed to 34.4 ng E2/l. C: heat map illustrating the relative expression level of all differentially regulated transcripts in all individual samples (individuals are represented by the same codes as in B). Data presented are log10-transformed read counts per transcript. The hierarchical clustering to generate gene and condition trees was conducted using a Euclidean distance metric in the R pheatmap package.

