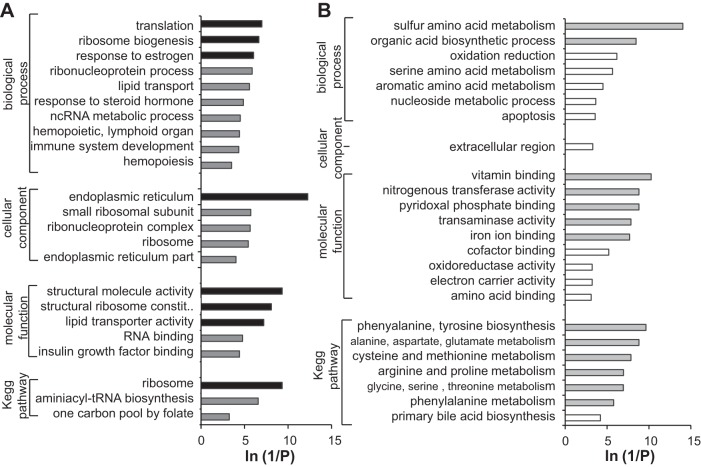
Fig. 2.
Overrepresented Gene Ontology (GO) terms and KEGG pathways (P < 0.05) in the list of upregulated (A) and downregulated transcripts (B) in fish exposed to 34.4 ng/l E2. Values presented represent the P value associated with overrepresentation. Darker shaded bars indicate GO terms where the adjusted P value was < 0.05 (Benjamini-Hochberg correction). Analysis was conducted using the Database for Annotation, Visualization and Integrated Discovery (DAVID) (Huang et al. 2008) v6.7, using our brown trout liver transcriptome as a background and Reduce and Visualize Gene Ontology (Revigo)(53) to condense redundant terms.

