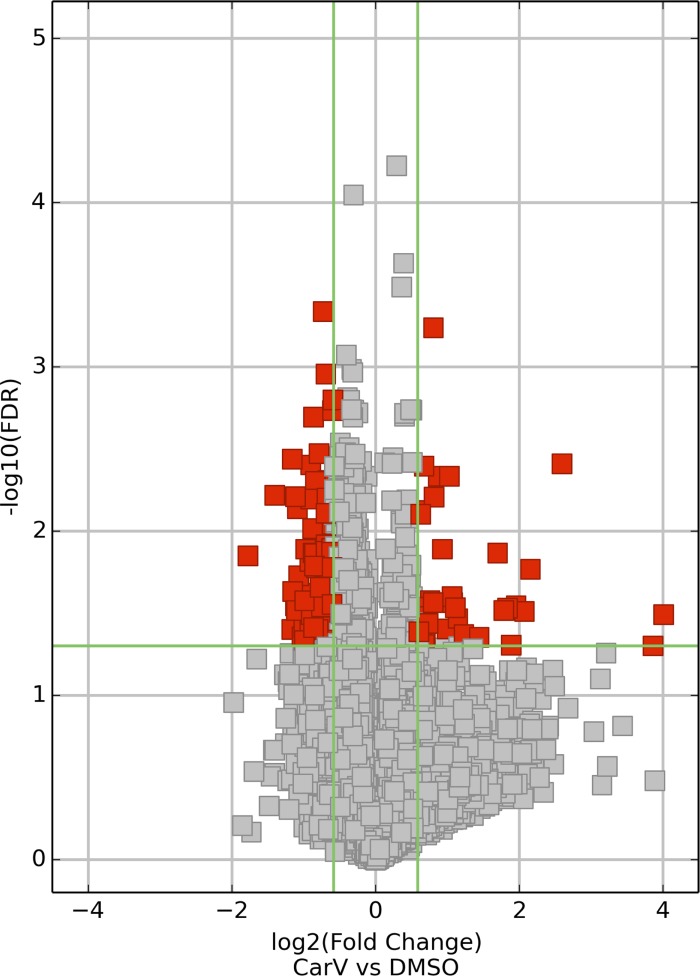
Fig. 2.
Volcano plot analysis of differentially expressed (DE) mRNAs. Volcano plots are constructed from fold-change values and false discovery rate (FDR) values, allowing one to visualize the relationship between fold-change and statistical significance (which takes both magnitude of change and variability into consideration). The vertical lines correspond to 1.5-fold up and down, and the horizontal line represents an FDR value of 0.05, so the red points in the plot represent the differentially expressed (DE) mRNAs with statistical significance.

