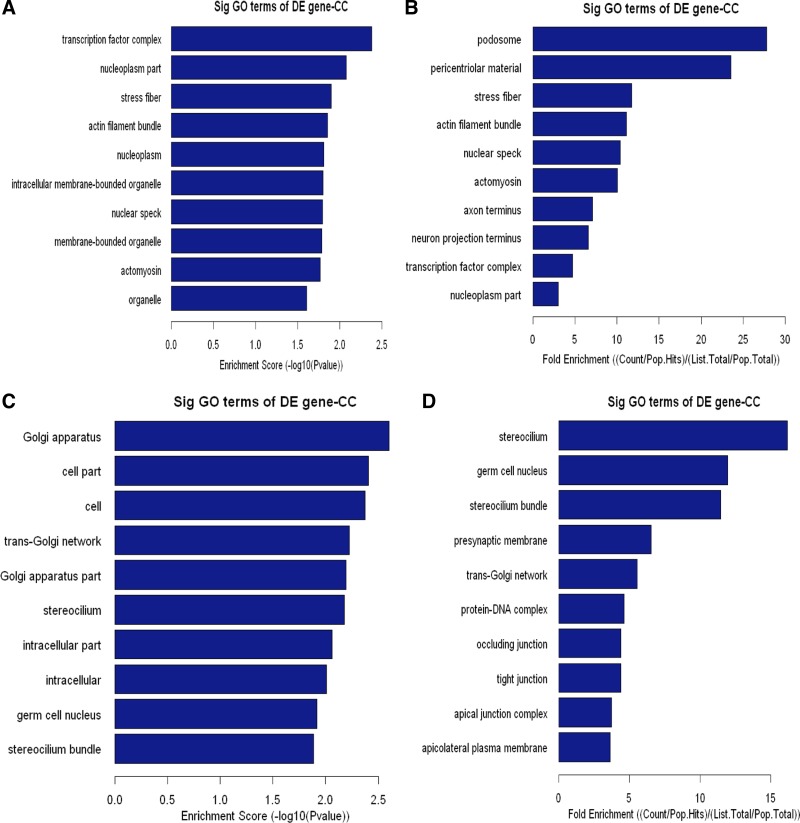
Fig. 3.
Cellular component (CC) analysis of DE genes. The upregulated (A, B) or downregulated (C, D) genes were classified by CC by the Gene Ontology (GO) classification system. Fisher's exact test is used to find if there is more overlap between the DE list and the GO annotation list than would be expected by chance. The P value denotes the significance of GO terms enriched in the DE genes. The top 10 terms with the lowest P value are shown as bar plots. A or C: Enrichment Score, the GO ID's enrichment score value, and it equals [−log10(P value)]. B or D: Fold Enrichment, the GO ID's fold enrichment value, and it equals (Count/Pop.Hits)/(List.Total/Pop.Total). Pop.Hits, the number of background population genes associated with the listed GO ID. List.Total, the total number of DE genes. Pop.Total, The total number of background population genes.

