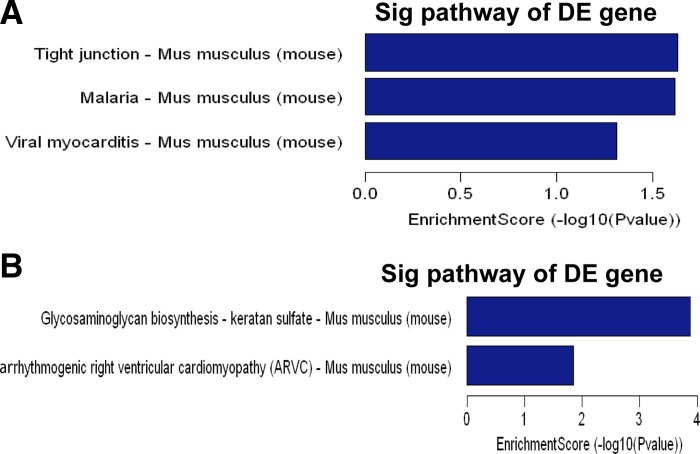
Fig. 6.
Signaling pathway analysis of DE genes. Pathway analysis is a functional analysis mapping genes to KEGG pathways. The P value denotes the significance of the pathway correlated to the conditions [upregulated (A) or downregulated (B) in Carv compared with DMSO control]. Enrichment score is the value of the Pathway ID, and it equals “−log10(P value)”. The bar plot shows the top 5 enrichment score value of the significant enrichment pathway. DE genes identified in both microarray and real-time PCR verification analyses (Tables 1 and 2, Supplementary Tables S1 and S2) are only included for pathway analysis.

