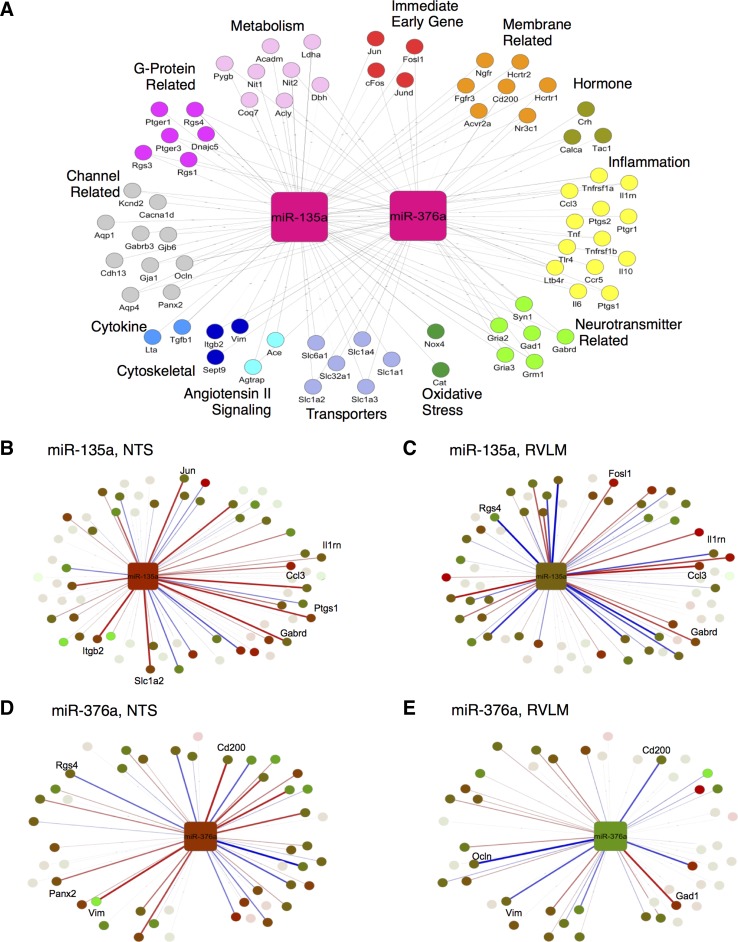
Fig. 8.
Network representation of microRNA. A: putative target mapped to pathway annotations derived from literature and gene ontology. Key microRNAs at the hypertension onset stage in NTS of miR-135a regulatory network (B) and miR-376a regulatory network (D). Key microRNAs at the prehypertension stage in RVLM of miR-135a regulatory network (C) and miR-376a regulatory network (E). Edges are mapped to correlation data differences of SHR-WKY. Blue, positive; red, negative. Line connections are present if the transcript is a predicted target of a microRNA with line thickness representing relative strength of correlation subtraction (−2, 2).

