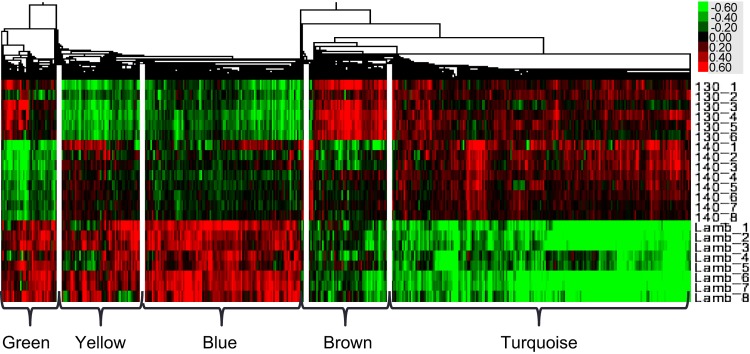
Fig. 2.
Heat map showing the clusters of covarying gene expression detected in the expression data by WGCNA analysis, labeled with colors to represent the different patterns of gene coexpression over time. 130_1 through 130_6 are the 6 130-day gestation samples, 140_1 through 140_8 the 8 term samples, and Lamb_1 through Lamb_8 are the 2 wk old samples. The colored scale for the heat maps, top right, shows the fold change in expression levels of the gene from the normalization point, where green is decreased, and red increased, expression.

