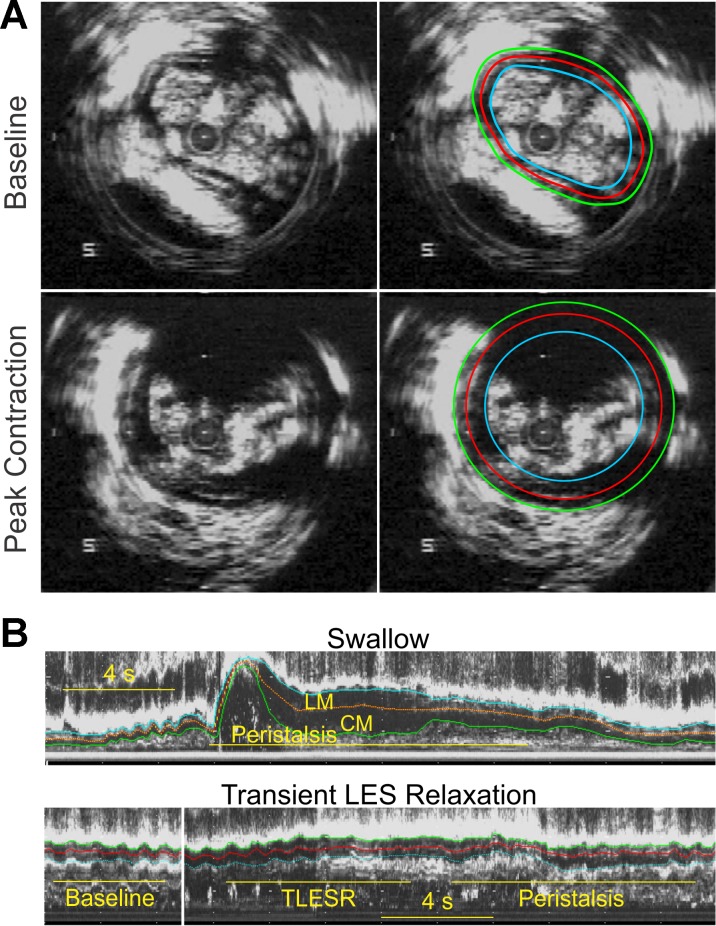
Fig. 2.
A: B-mode ultrasound (US) image of the esophagus and manually drawn markings to measure cross-sectional area (CSA) of the CM and LM layers. B: esophageal M-mode ultrasound image 6 cm above the LES with manually drawn markings for the CM, LM, and septum during peristalsis and transient LES relaxation (TLESR).

