
Figure 1. The alchemic mutation of E289A NS in MD simulations.
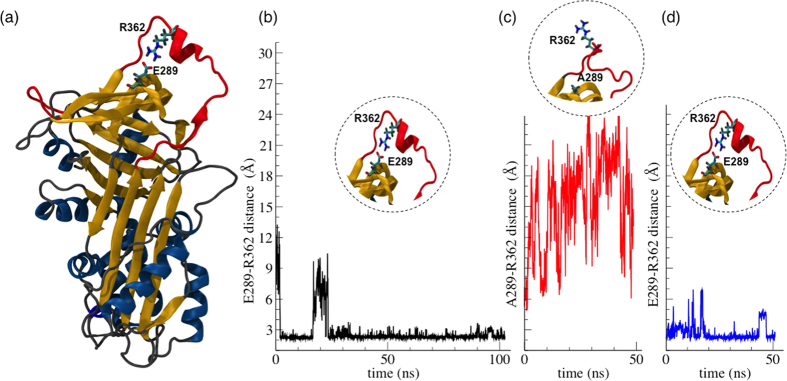
(a) Cartoon representation of native NS; the lateral chains of residues E289 and R362 are shown in bond representation. (b–d) Time evolution of the distance between the selected residues highlighted in the circular insets: (b) E289-R362 (black line) in WT NS; (c) A289-R362 (red line) in E289A NS; (d) E289-R362 (blue line) in WT NS after the back mutation A289E;