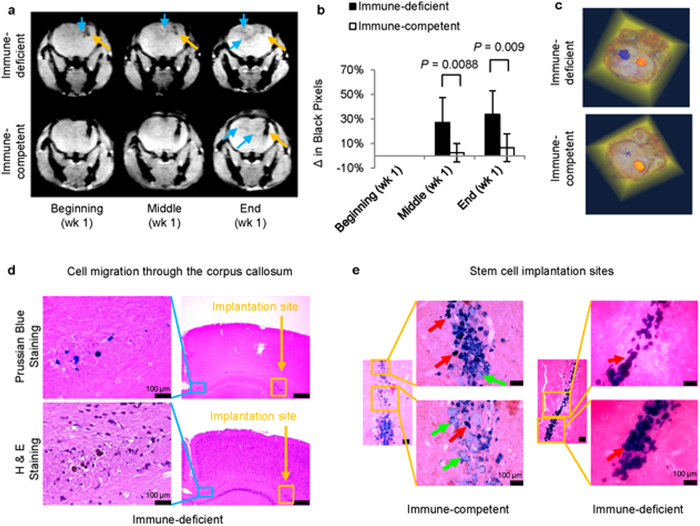
Figure 7. In vivo imaging of cell delivery and cell migration.
(a) T2*-weighted images of immune-deficient and immune-competent mouse brains, indicating the site of cell delivery ( ) and cell migration to the radiation-induced lesion (
 ). (b) Black-pixel analyses of T2*-weighted images of mouse brains from both groups at the middle and end of week one, indicating significant cell migration to the radiation-induced lesion site (n = 5; P < 0.0088 and P < 0.009, respectively). (c) Three-dimensional reconstruction of T2*-weighted MR images of brains from immune-deficient and immune-competent mice, indicate cell distribution at both the implantation and radiation-induced lesion sites. (
 ) represents the dual magnetically labelled cells lodged at the implantation site. (
 ) represents the migrated dual magnetically labelled cells at the radiation-induced lesion sites. (d) Histology of adjacent slices of a representative immune-deficient mouse brain indicates the migration of iron-containing cells from the implantation site to the lesion site through the corpus callosum. (
 ) represents the dual magnetically labelled cells lodged at the implantation site. (
 ) represents migrating dual magnetically labelled cells. (e) Perl’s Prussian blue staining of stem cell implantation tracts of both immune-deficient and immune-competent mice. (
 ) implanted cells, and (
 ) infiltrating cells.

