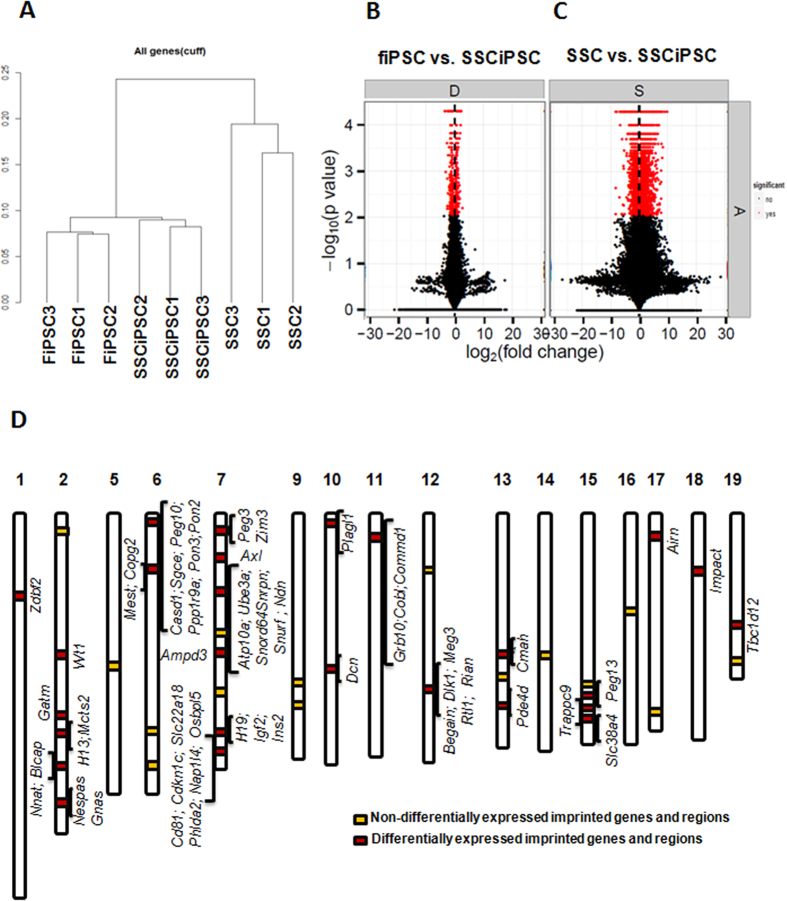
Figure 2. Global transcriptome profile of imprinted and non-imprinted loci as revealed by RNAseq analysis.
(A) Hierarchical clustering of the nine biological samples analyzed; (B,C) Differentially expressed genes (FDR<0.05) between SSC and SSCiPSC (8124 genes, (B)) or fiPSC and SSCiPSC (490 genes, (C)); (D) Representation of the 41 known imprinting clusters along the mouse genome. Yellow squares depict clusters (15) with no differentially express genes, red squares denote clusters (26) with differentially expressed imprinted genes.

