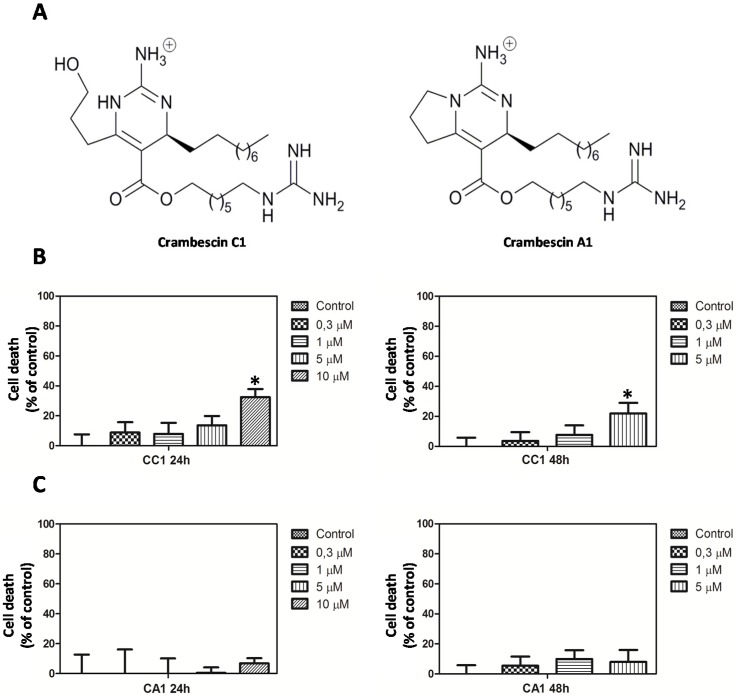
Figure 1.
(A) Structure of crambescin C1 (CC1) and crambescin A1 (CA1); (B) Proliferation of HepG2 cells after CC1 treatment for 24 and 48 h; (C) Proliferation of HepG2 cells after CA1 treatment for 24 h and 48 h. In both cases cellular growth was determined by the 3-(4,5-dimethylthiazol-2-l)-2,5-diphenyltetrazolium bromide (MTT) method. * Significant differences respect to controls, p < 0.05, n = 3.

