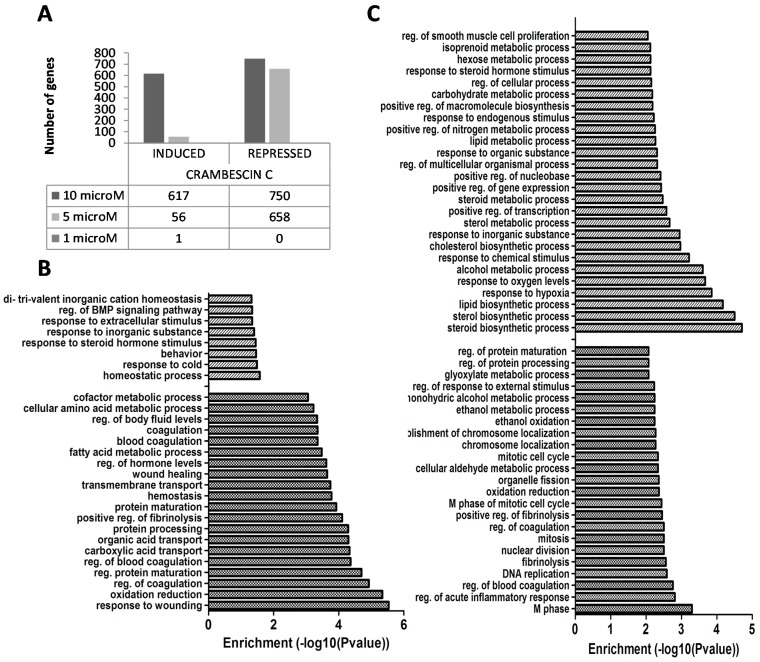
Figure 3.
(A) Induced and repressed genes after 24 h treatment of HepG2 cells with crambescin C1 (CC1), determined by microarray analysis; (B) Biological processes significantly altered in 5 μM CC1 treated HepG2 cells, determined by ontological analysis of up- and down-regulated genes. Dashed bars: up-regulated biological processes. Dotted bars: down-regulated biological processes; (C) Biological processes significantly altered in 10 μM CC1 treated HepG2 cells, determined by ontological analysis of up- and down-regulated genes. Dashed bars: up-regulated biological processes. Dotted bars: down-regulated biological processes.

