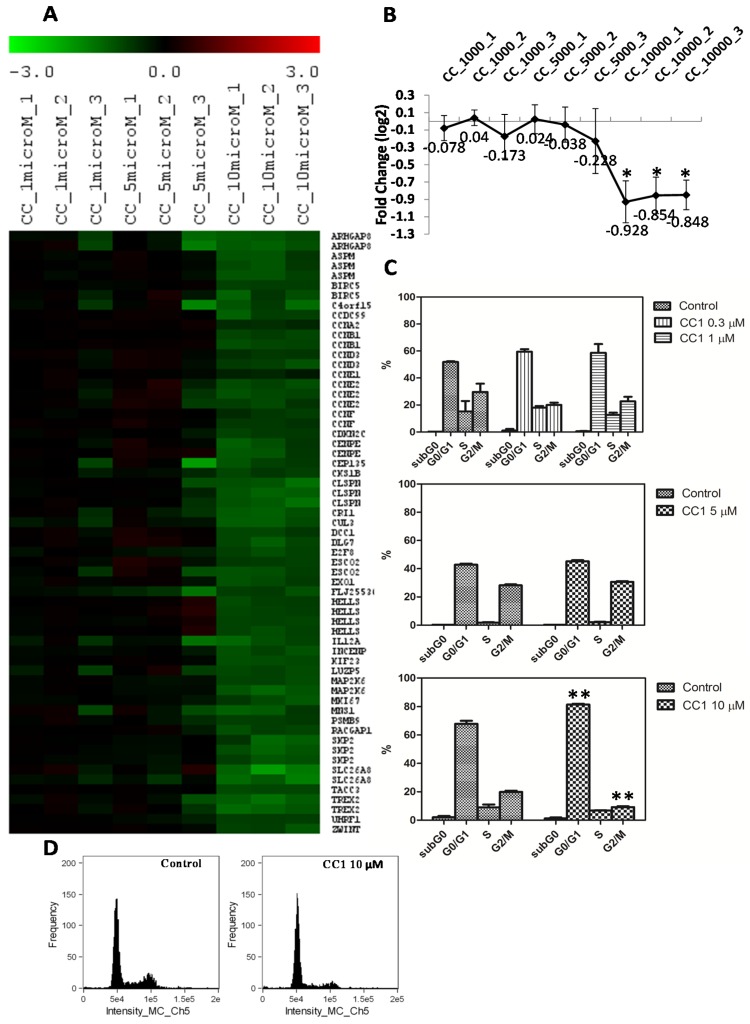
Figure 5.
(A) Heat map of the differentially expressed (DE) mRNAs coding for proteins involved in cell cycle regulation in HepG2 cells treated with 1 μM, 5 μM and 10 μM crambescin C1 (CC1) with respect to control cells. Green color represents mRNA down-regulation of treated cells with respect to controls; (B) Centroid graph for down-regulated genes showed in A. * Significant differences with respect to controls and 5 μM treated cells, p < 0.05, n = 3; (C) Quantification of the cell population percentages in each phase of the cell cycle in control and HepG2 cells treated with 0.3 μM, 1 μM, 5 μM and 10 μM CC1 for 24 h. (p < 0.01, n = 2); (D) Analysis of the relative fluorescence intensity of the stained nuclei. Histograms indicate the differences in the relative proportions of cells in G0/G1 and G2/M phases between control and 10 μM CC1 treated cells.

