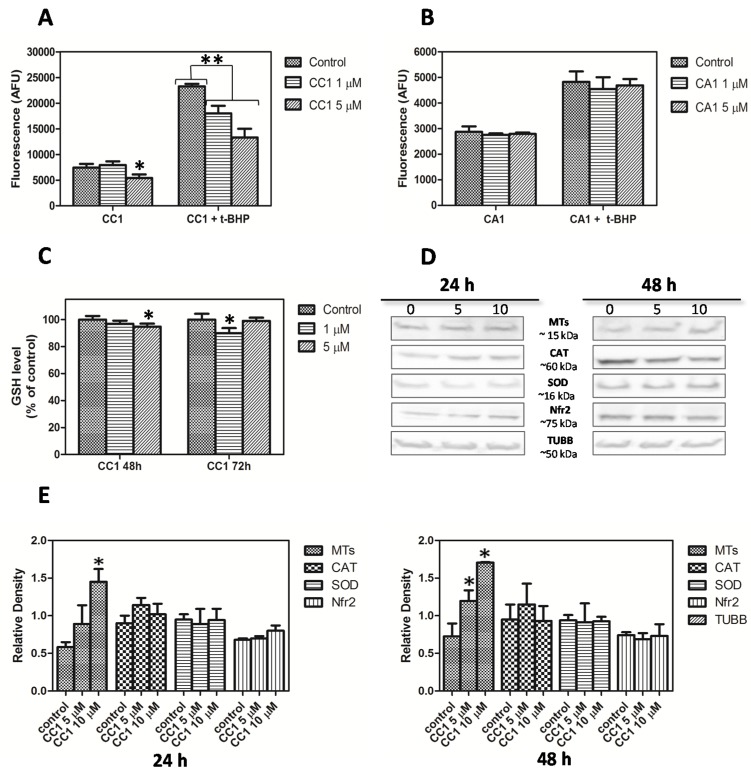
Figure 6.
(A) Measurement of reactive oxygen species (ROS) generation and evaluation of the HepG2 antioxidant response after 48 h treatment with 1 μM and 5 μM crambescin C1 (CC1); (B) Measurement of ROS generation and evaluation of the HepG2 antioxidant response after 48 h treatment with 1 μM and 5 μM CA1; (C) Cellular level of reduced glutathione in HepG2 cells treated with 1 μM and 5 μM CC1 for 48 and 72 h; (D) Western blot analysis of soluble MT-1 and -2, CAT, SOD, Nfr2 and anti-β-tubulin (TUBB, reference for loading normalization) levels in HepG2 cells treated with 5 μM and 10 μM CC1 for 24 h and 48 h. Representative images are shown. Three experiments were performed for each analyzed protein; (E) Quantification of the differences in protein levels among control, 5 μM and 10 μM CC1 treated cells. * Significant differences with respect to controls, p < 0.05.

