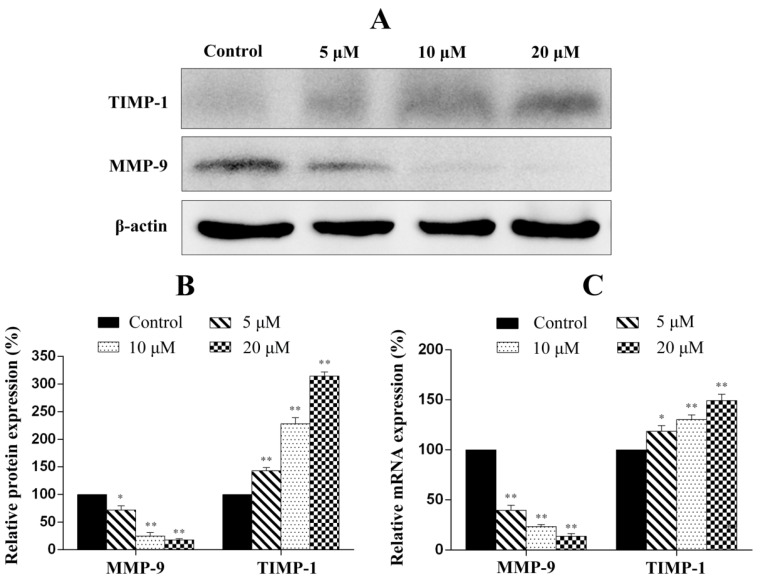
Figure 11.
RT-qPCR and western blot analysis of the metastatic-associated molecules in A-375 cells. (A) After cells were treated with different concentration of penicitrinine A for 24 h, western blot analysis was performed using antibodies against TIMP-1, MMP-9 and β-actin; (B) Densitometric analysis of MMP-9 and TIMP-1 at protein levels; (C) A-375 cells were treated with 0, 5, 10 and 20 µM penicitrinine A for 24 h. The mRNA level from whole cell lysates was analyzed by RT-qPCR, GAPDH was used as a loading control. Data are expressed as mean ± SEM (n = 3). * p < 0.05, ** p < 0.01 vs. the control group.

