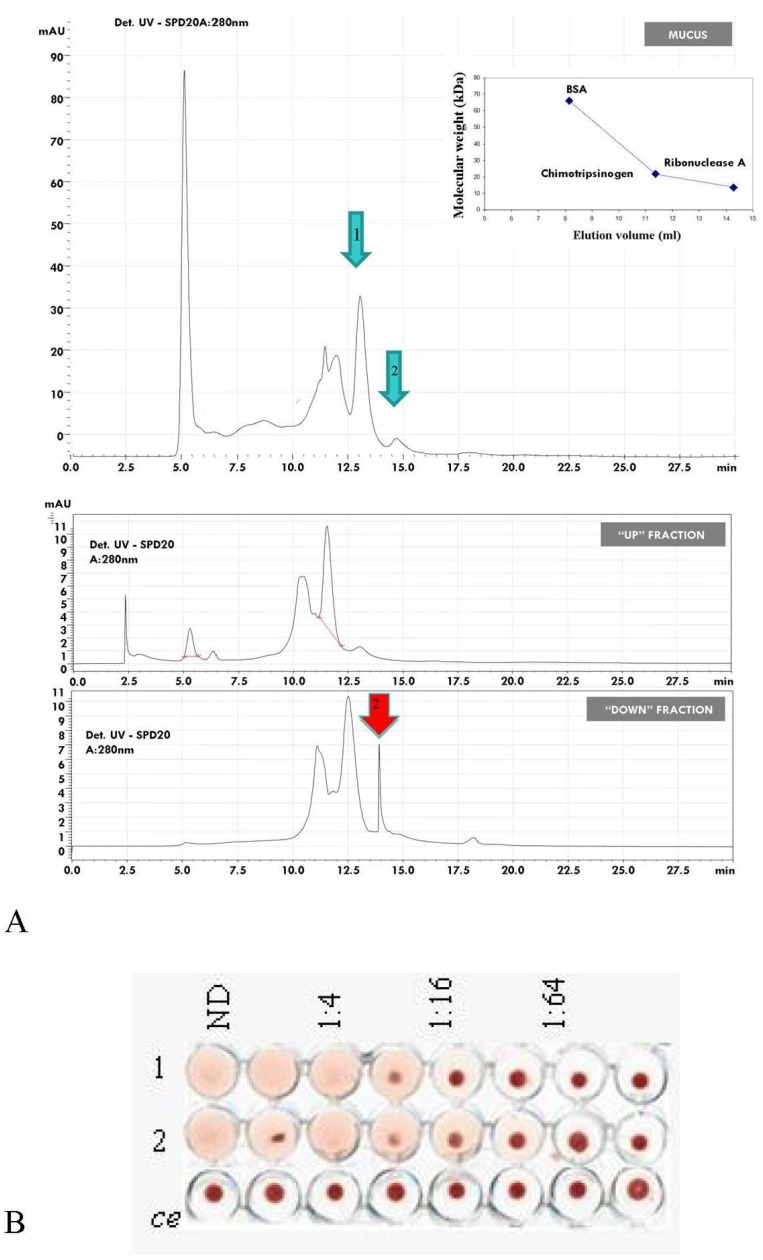
Figure 5.
(A) High performance liquid chromatography separation of A. equina mucus components. The first plot shows profile of HPLC analysis of the crude mucus extract. Green arrows 1 and 2 indicate the isolated peaks at 12.5 and 14.5 min. Insert shows HPLC profiles of bovine serum albumin (BSA-66 kDa), chimotrypsinogen (25 kDa) and ribonuclease (13.7 kDa) used as standards separated on a molecular weight exclusion column BioSuite 250 (10 microns; Waters, Milford, CT, USA). The second plot shows the purification profiles of the high molecular weight fraction (u = upper) and low molecular weight fraction (d = lower) previously separated via centrifugation system on 10 kDa membrane. Red arrow indicate peak 2 detected at 14.5 min post HPLC start running; (B) Lytic activity detected in microplate toward rabbit erythrocytes of peaks 1 and 2 (Ce: Control experiment).

