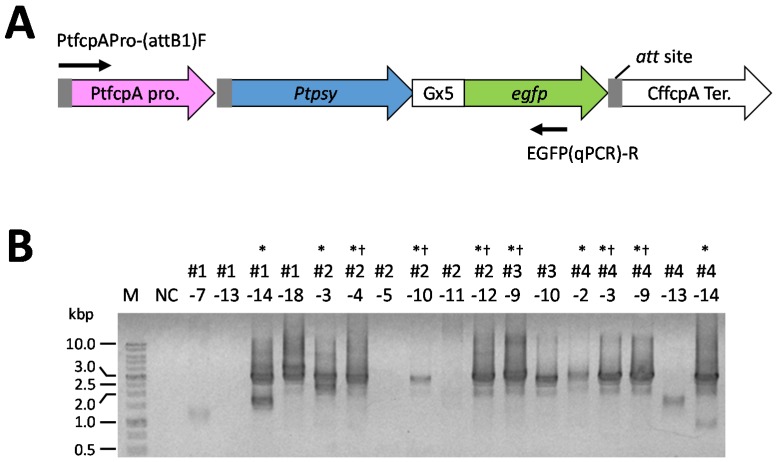
Figure 5.
Genomic PCR analysis of the transformed P. tricornutum. (A) The illustration of transgenes. Arrows indicate the primers used for PCR determination; (B) typical electrophoretogram of genomic PCR determination of the P. tricornutum transformants. NC shows a negative control without template cells; M: DNA size maker; * indicate that transformants clones possessed the DNA fragment containing the Ptpsy::Gx5::egfp with the PtfcpA promoter (approximately 2700 base pairs); † indicates transformants clones used for the determination of total carotenoid content by the spectrophotometric analysis [64].

