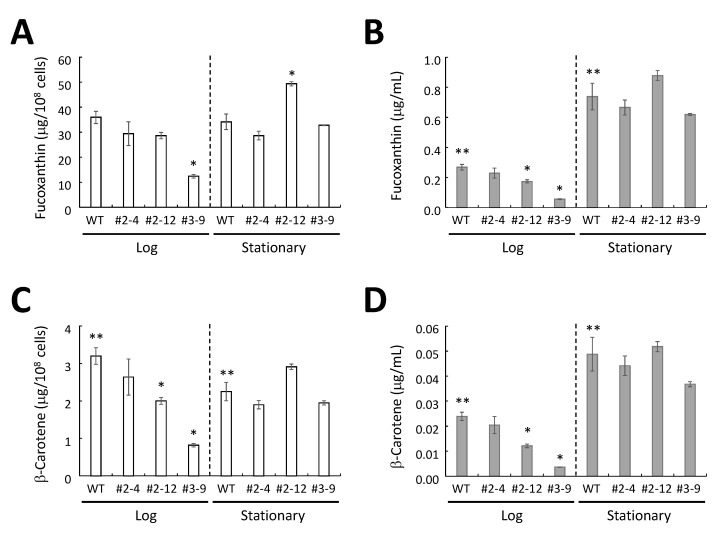
Figure 8.
Carotenoid content in P. tricornutum in the log and stationary phases. The content of fucoxanthin per cells (A) and per mL culture medium (B). The content of β-carotene per cells (C) and per mL culture medium (D). The data represent the average values of the three independent experiments with standard error. * Above bars denotes significantly different from the carotenoid content of the wild-type (WT) cells; ** above bars of the wild-type denotes significantly different between the carotenoid content of the wild-type cells at the log phase and the stationary phase.

