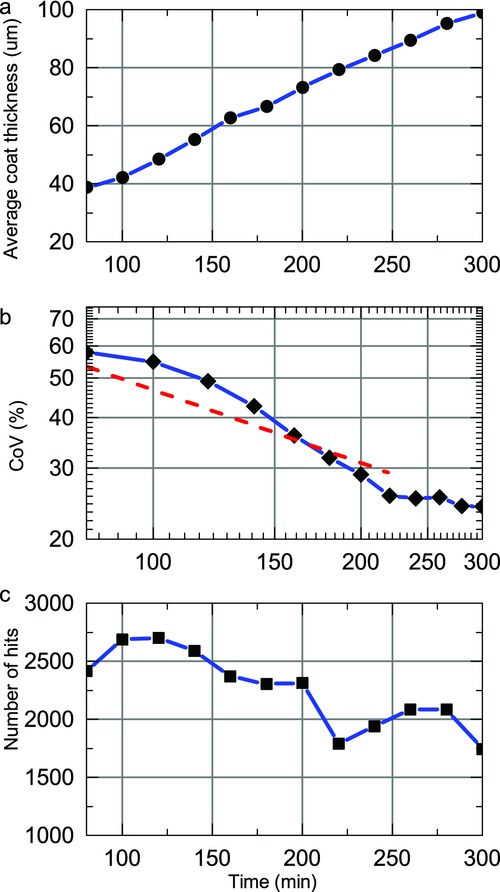
Figure 6.

Curve-fitted mean (a), inter-tablet variability (log–log scale) (b) and number of tablet coating thickness (c) during a coating run where the baffles were removed after 200 min process time. Lines are plotted to guide the eye. The red dashed line corresponds to a linear fit describing the decrease in the inter-tablet variability to extract the rate of decrease in CoV.
