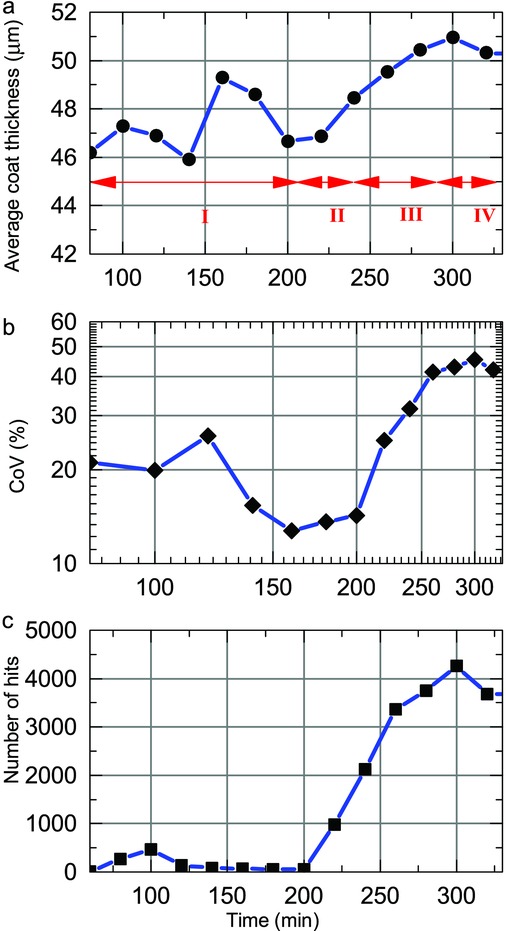
Figure 10.

Curve-fitted mean coating thickness (a), inter-tablet variability (log–log scale) (b) and number of measurements (c) at different periods of the coating run that was characterised by process perturbations such as halting pan rotation (I), restart coating (II), reducing spray rate (III) and stop spraying (IV).
