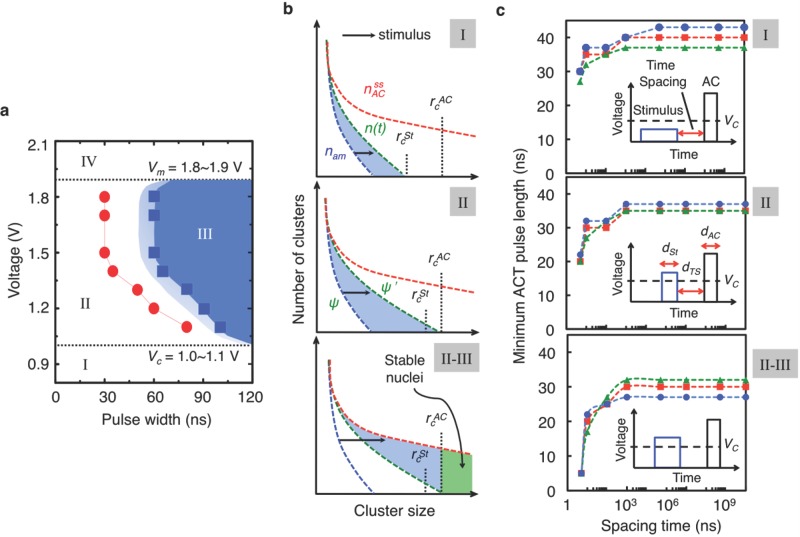
Figure 1.
Variation of TA-states upon electrical-pulse stimuli. a) Schematic VW diagram. The VW diagram can be classified into four distinct regions, I-IV (see supplementary information for their characteristics). Vm and Vc denote the minimum continuous voltage for melting and full crystallization, respectively. The blue (or red) data points indicate the minimum ACT pulse length before (or 1 sec after) applying a stimulus pulse (1.1 V/90 ns). The light (or dark) blue region represents the pulses that induce partial (or full) crystallization, prior to being exposed to any stimulus pulse. In particular, the boundary region between II and III (i.e., near the partially crystallized zone) is drawn only for a schematic illustration, which is based on the rather coarse data points in Figure S2. b) Schematic description of the evolution of cluster-size distributions upon the application of stimulus pulses corresponding to different regions in the VW diagram. Note the different positions of rc at different stimulus ( ) and ACT (
 ) pulses. c) Dependence of the minimum ACT pulse length on pulse parameters for three different test cells. The ACT pulse is denoted in the inset as AC. The stimulus pulses employed in the top, middle, and bottom panels were 0.9 V and 900 ns (region I), 1.1 V and 60 ns (region II), and 1.1 V and 90 ns (region II-III), respectively. The ACT voltage was kept constant at 1.5 V. It is noted that each minimum ACT pulse length for zero spacing time is the same as that for 5 ns of spacing time.

