
Figure 3.
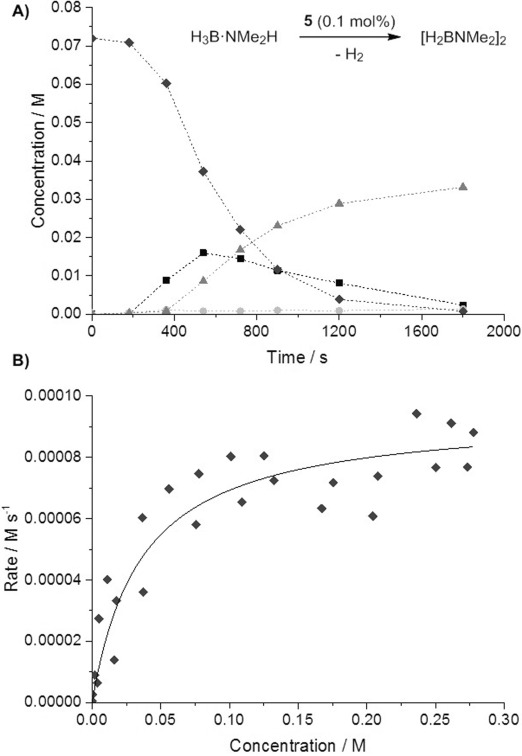
A) Concentration versus time plots (as measured by 11B NMR spectroscopy) for species H3B⋅NMe2H (♦, black), H2B=NMe2 (▪, black), HB(NMe2)2 (•, light gray), and [H2BNMe2]2 (▴, dark gray). Conditions: [H3B⋅NMe2H]0=0.072 m, [5]=7.2×10⁻⁵ m, 1,2-C6H4F2 was used as solvent, open conditions, 298 K. B) Plot of rate versus [H3B⋅NMe2H] for the dehydrocoupling of [H3B⋅NMe2H] by 5, showing the post-induction period. Separate experiments spanning the range 0.288–0.018 m were carried out. The line of best fit is to guide the eye only.[24]