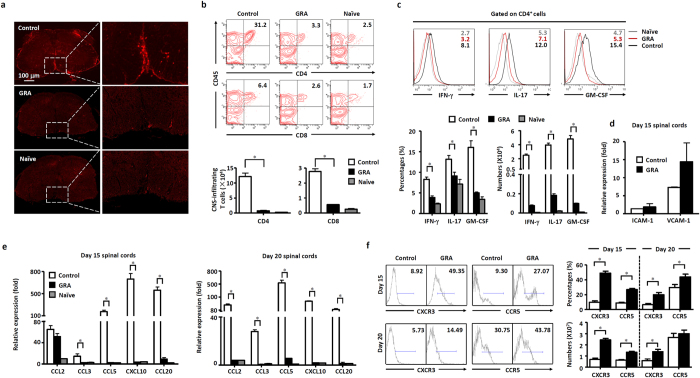
Figure 3. GRA inhibits chemokine expression and proinflammtory infiltration of T cells in the CNS of EAE mice.
(a) Representative images of CD4 T cell infiltration in day 15 spinal cords of naïve, control and GRA-treated EAE mice following the therapeutic treatment protocol. (b) CNS-infiltrating T cells isolated from spinal cords from naïve, control EAE and GRA-treated mice at day 15 were analyzed. Representative dot plots were shown on the upper panel percentages and absolute numbers of cells are shown on the bottom panel (n = 6). (c) Spinal cords were isolated from naïve, control EAE and GRA-treated mice at day 15, surface marker and intracellular expression of cytokines were analyzed. Representative dot plots were shown on the upper panel, percentages and absolute numbers of cells were shown on the bottom panel (n = 6). (d) Quantification of mRNA abundance for ICAM-1 and VCAM-1 in the CNS from day 15 control and GRA-treated EAE mice. (e) Quantification of mRNA abundance for chemokines in the CNS from day 15 and 20 control and GRA-treated EAE mice. (f) The proportion of CXCR3+CD4+ and CCR5+CD4+ T cells in DLN cells from day 15 and 20 control and GRA-treated EAE mice. Representative dot plots were shown on the left, percentages and absolute numbers of cells were shown on the right (n = 6). Data are representative of three independent experiments. *P < 0.05.

