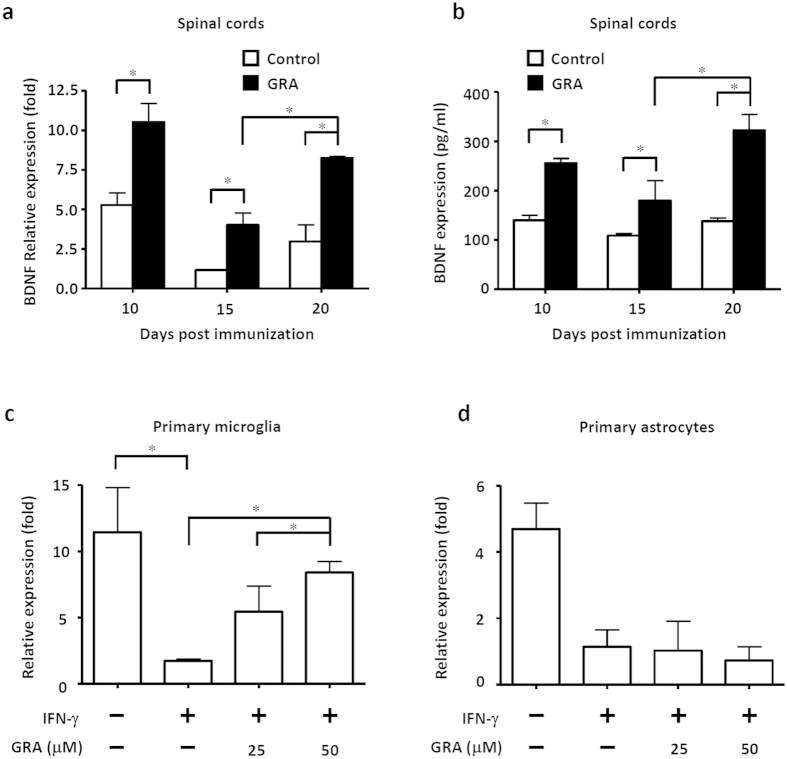
Figure 6. GRA-modulated microglia but not astrocyte exhibit promoted BDNF expression.
(a) Quantification of mRNA abundance for BDNF in the CNS from control and GRA-treated EAE mice at day 10, 15 and 20 following therapeutic treatment protocol (n = 6). (b) Levels of serum BDNF in the CNS from control and GRA-treated EAE mice by ELISA at day 10, 15 and 20 (n = 6). (c) Primary microglia were cultured in medium alone or treated with IFN-γ (100 ng/ml) or IFN-γ (100 ng/ml) plus GRA at the indicated concentrations, and mRNA abundance for BDNF was quantified. (d) Primary astrocytes were cultured in medium alone or treated with IFN-γ (100 ng/ml) or IFN-γ (100 ng/ml) plus GRA at the indicated concentrations, and mRNA abundance for BDNF was quantified by real-time PCR. Data are representative of three independent experiments. *P < 0.05.

