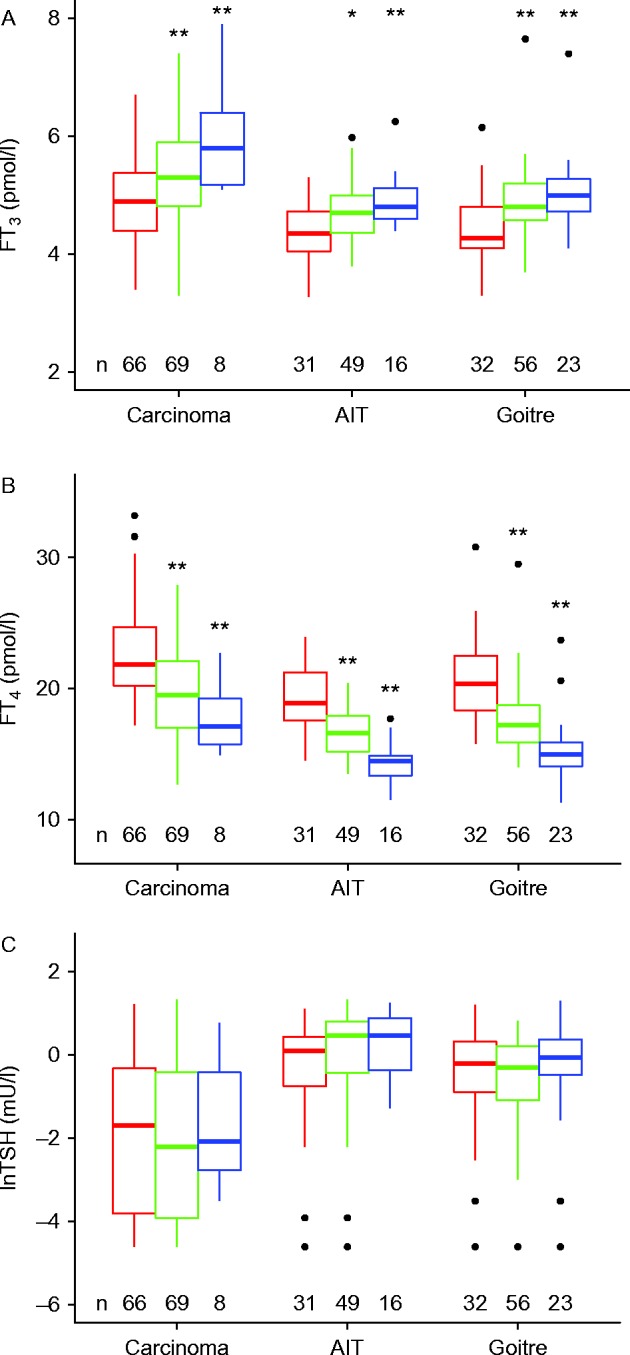
Figure 2.

FT3 (A), FT4 (B) and TSH (C) levels in l-T4-treated patients stratified by disease and conversion efficiency. The disease entities were closely associated with categories of the thyroid volume (see Table 1 and text). The red box refers to poor converters (calculated deiodinase activity <23 nmol/s), green to intermediate converters (deiodinase activity 23–29 nmol/s) and blue to good converters (deiodinase activity >29 nmol/s). Remarkably, absolute FT3 concentrations were lowest in the poor converter group in all disease categories, while FT4 levels were highest in the poor converters. Wilcoxon test, revealed significant differences compared to each first group; *P<0.05, **P<0.001. AIT, autoimmune thyroiditis; goitre, goitre post surgery for benign nodular thyroid disease.

 This work is licensed under a