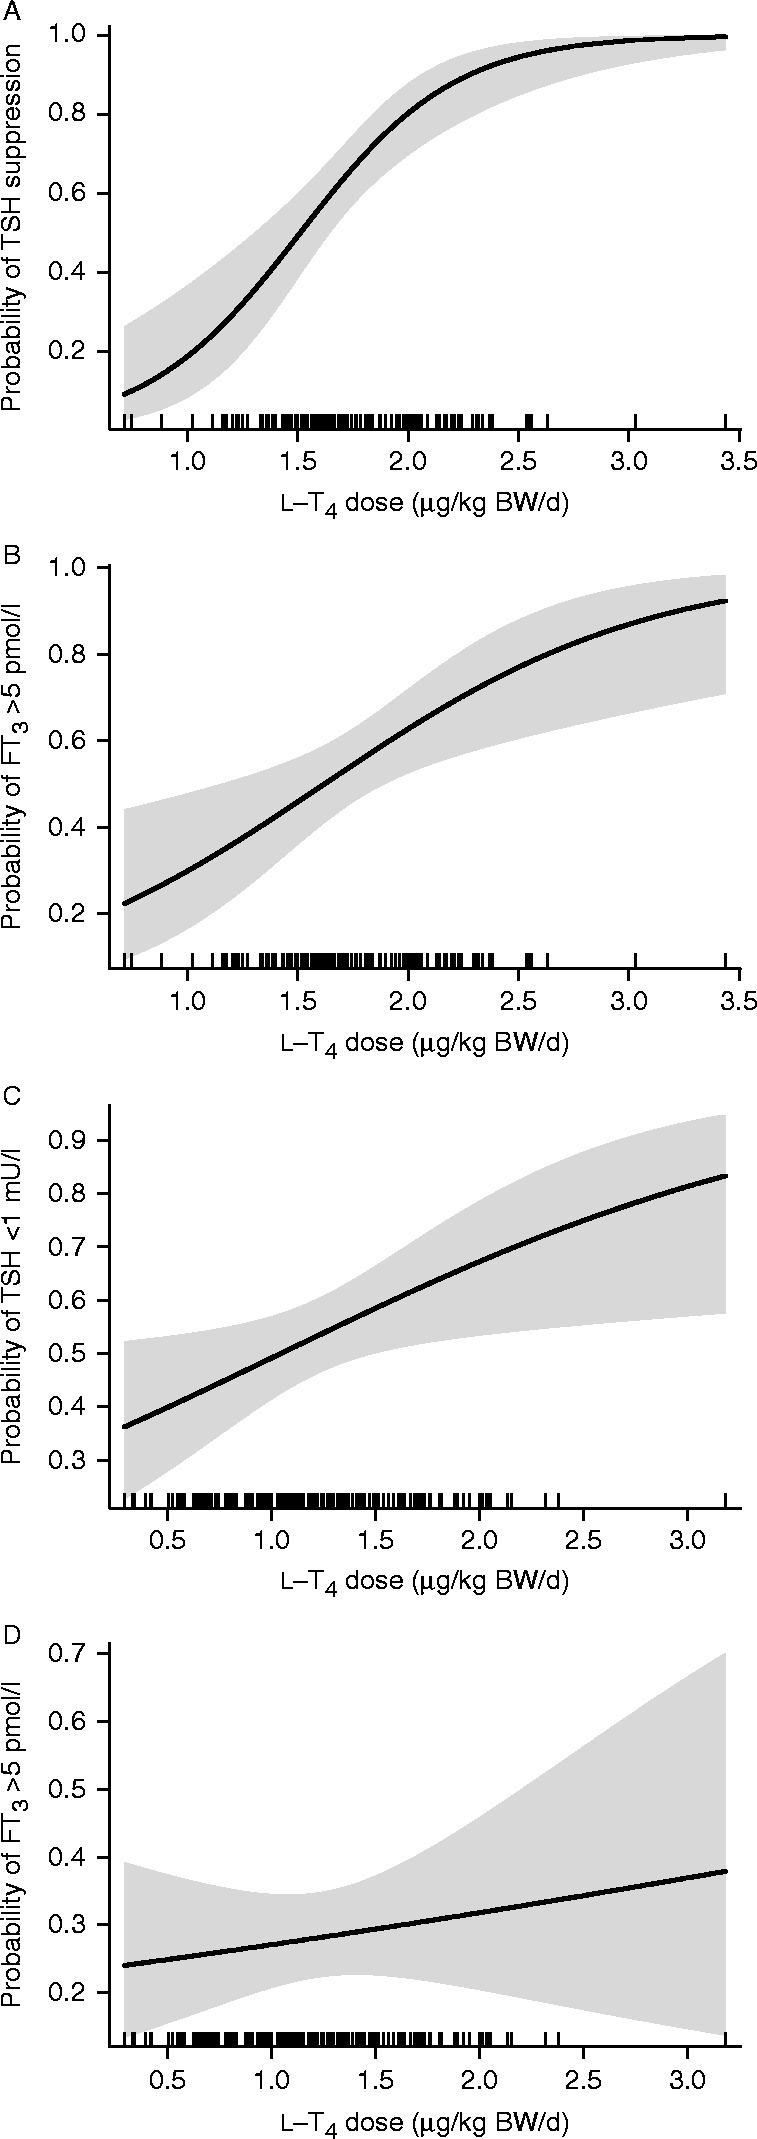
Figure 3.

Probability plot of weight adjusted l-T4 dose to (A) suppress TSH below its lower reference limit (0.4 mU/l) or (B) raise FT3 above the median of euthyroid controls (>5 pmol/l) in the carcinoma patients (n=143), and (C) suppress TSH <1 mU/l or (D) elevate FT3 above 5 pmol/l in benign disease (patients with autoimmune thyroiditis, n=75 and nodular thyroid disease post surgery, n=111). Probability plots were created by logistic regression. The shaded areas indicate the confidence interval surrounding the fitted curve. The TSH targets were more frequently reached at a lower dose than the FT3 target (see Results).

 This work is licensed under a