Figure 3.
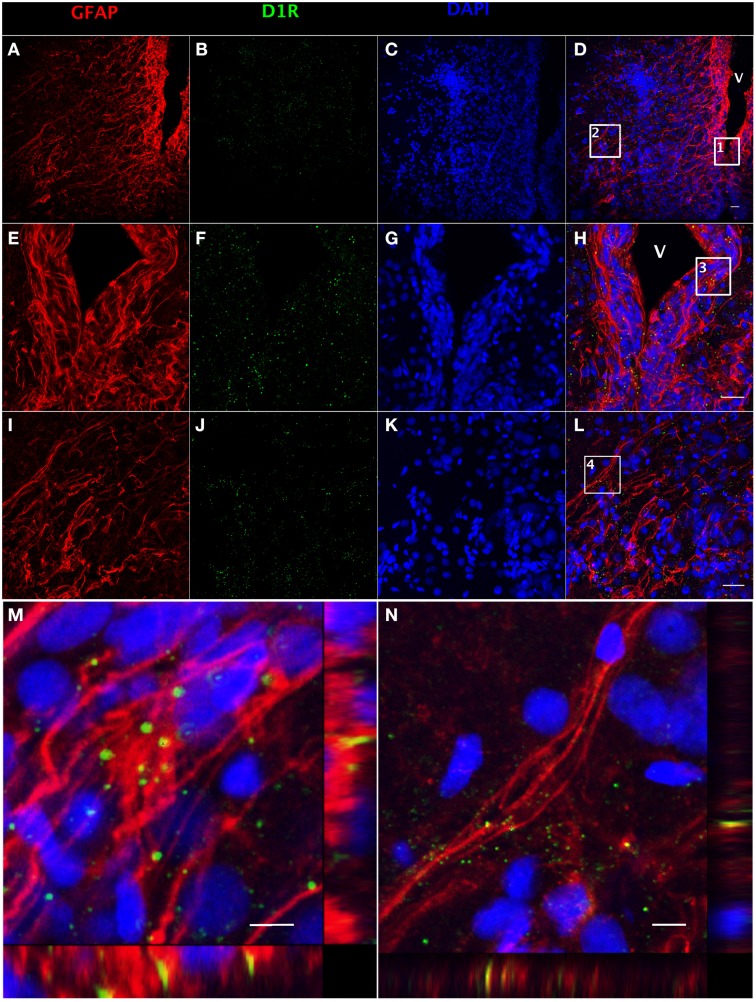
Double fluorescence detection of GFAP (red) and D1R (green) in ventral telencephalic area of female goldfish brain. The confocal image shows that RGCs marked by GFAP are located at the ventricular surface (A,E) with fibers extending to the area ventralis telencephali pars ventralis (I) and the expression of D1R at the ventricular surface and the area ventralis telencephali pars ventralis (B,F,J). The expression of D1R by RGCs is shown in the merged images (V; ventricle, D,H,L). Magnification of the boxed area 1 in (D) shows that D1R is expressed by RGCs along the ventricular surface (H). Magnification of the boxed area 2 in (D) shows that D1R is expressed by RGCs in the area ventralis telencephali pars ventralis (L). Single slice scanning view of the boxed area 3 in panel H shows the colocalization of D1R and GFAP in RGCs along the ventricular surface (M). Slice scan view of the boxed area 4 in (L) shows the colocalization of D1R and GFAP in RGCs in the area ventralis telencephali pars ventralis (N). The nuclear stain DAPI (blue) is also shown (C,G,K). Scale bar = 20 μm in (A–L); Scale bar = 5 μm in (M,N).

