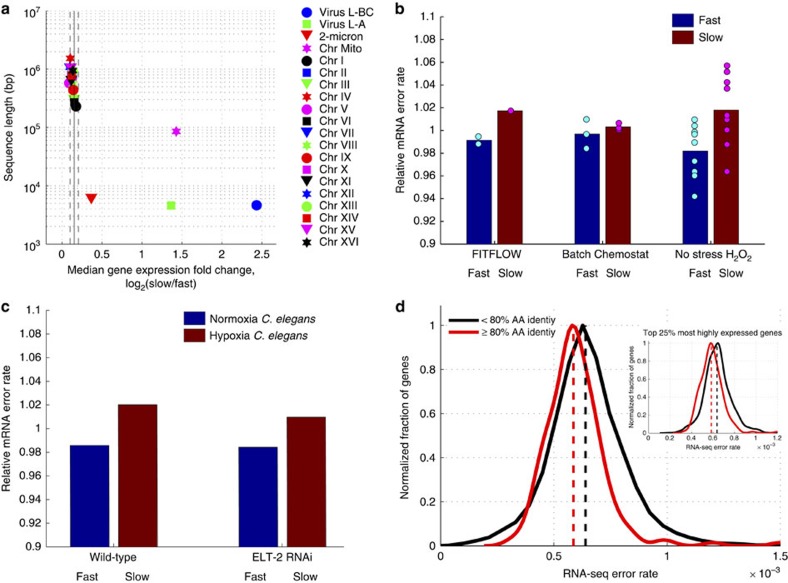
Figure 4. Slow-growing cells exhibit more transcript errors.
(a) For each genomic nucleic acid molecule (plasmid, chromosome or RNA virus), the median expression fold change, across all genes (x axis), is graphed versus nucleic acid sequence length. Vertical solid and dashed lines show mean and s.d. of the 16 native yeast chromosomes. Mitochondria (magenta star), two viruses (blue circle and green square) and the 2-micron plasmid (red triangle) show significantly stronger upregulation in slow cells compared with the 16 yeast chromosomes. (b) The number of RNA-seq errors was measured across the genome for three different experiments performed in three different labs. RNA-seq data from isogenic cells that differ only by their stochastic growth rate, the growth conditions, or have been grown in H2O2 for 30 min, were analysed to measure the amount per-nucleotide transcriptome variability in each condition. In all cases, slow-growing cells have more variability (t-test, P=0.013 for the H2O2 data, t-test P=0.004 for all the data combined. (c) To determine whether this effect is yeast specific, an identical genome-wide analysis was performed on RNA-seq data from C. elegans subjected to 0.5% O2 for 36 h. These hypoxia stressed nematodes also contain more errors in their transcriptomes. (d) More highly conserved genes (% amino acid identity across yeast species53) have lower RNA-seq error rates (average error rate across all experiments) suggesting a lower RNA polymerase II error rate (t-test, P<10−3). This is not a function of expression level; the correlation with amino-acid conservation is seen when looking at only the top 25% of genes by expression level (inset, P<10−6).

