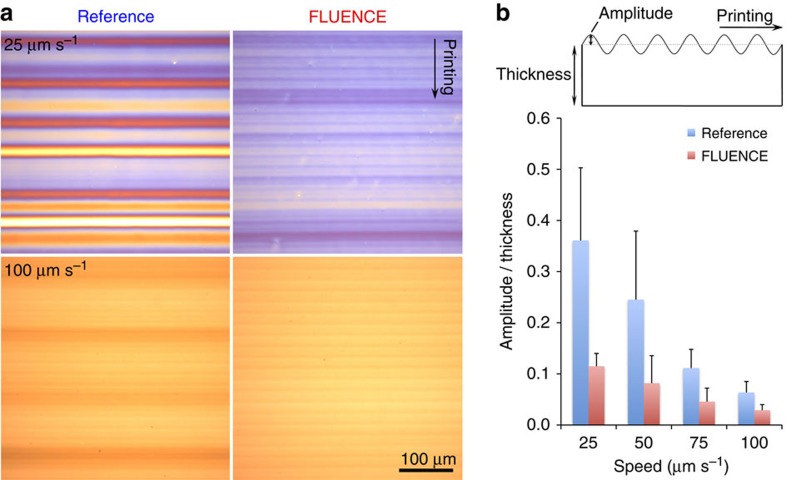
Figure 4. Comparison of surface roughness between FLUENCE-printed and reference thin films.
(a) Optical micrographs of blend films printed with flat (left) and micropillar-patterned (right) blades at 25 (top) and 100 (bottom) μm s−1. All images share the same scale bar as shown. Wavy, periodic surface patterns are observed with pitches of 120–200 μm and 20 μm, respectively. (b) Reduction in surface roughness of FLUENCE-printed thin films as compared with the reference films, normalized by the film thickness. The y axis plots amplitude of the surface patterns over the thickness of the film, as illustrated in the schematic above the plot. The film thicknesses are 124±5, 96±8, 50±8, 30±2 nm for FLUENCE-printed films at 25, 50, 75 and 100 μm s−1, respectively. The error bars were calculated from five different thickness measurements across the thin films. Both the amplitude and the thickness were measured by profilometry.

