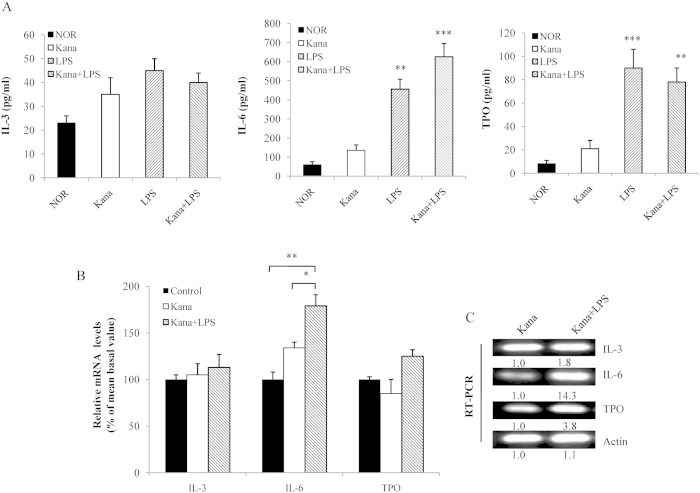
Figure 2. Levels of serum and mRNA expression of IL-3, IL-6 and TPO.
(A) The serum IL-3, IL-6, and TPO levels were measured by ELISA after LPS injection for 7 d in kanamycin-treated mice. Cells belonging to different stages of megakaryocyte cell maturity from the isolated bone marrow were separated on discontinuous BSA gradients. Significant results compared with the control are based on *P < 0.05 or **P < 0.01. (B) Relative mRNA levels of the megakaryocyte subpopulations were assessed by quantitative RT-PCR following treatment with kanamycin or kanamycin plus LPS. Two sets of 10 mice were used to determine the basal platelet levels. (C) RT-PCR was performed using total RNA obtained from immature and mature megakaryocytes with primers specific for IL-3, IL-6, and TPO. The fragments were visualized by ethidium bromide staining after separation. The numbers below the blots represent the relative expression levels.

