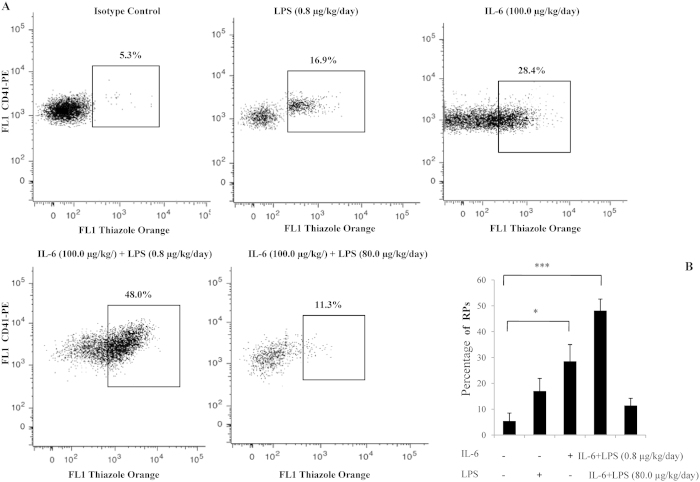
Figure 5. Detection of RPs in the whole blood of mice.
(A) Platelet fractions were identified by FACS forward-scatter and side-scatter parameters. The mean fluorescence intensity >1% of all platelets at baseline was used to set the threshold of the thiazole orange signal by analyzing 5000 platelets. Dot plots show the distribution of thiazole-positive events within the platelets in the whole blood. Regions are set on the RP percentage for blood samples from mice receiving LPS or IL-6 treatment alone or from LPS- plus IL-6-treated mice. The flow cytometric data were analyzed using a flow cytometer (Becton Dickinson) and CellQuest software. (B) Histogram showing the percentage of RPs stimulated by LPS and IL-6 in three independent experiments. *P < .05; **P < 0.01.

