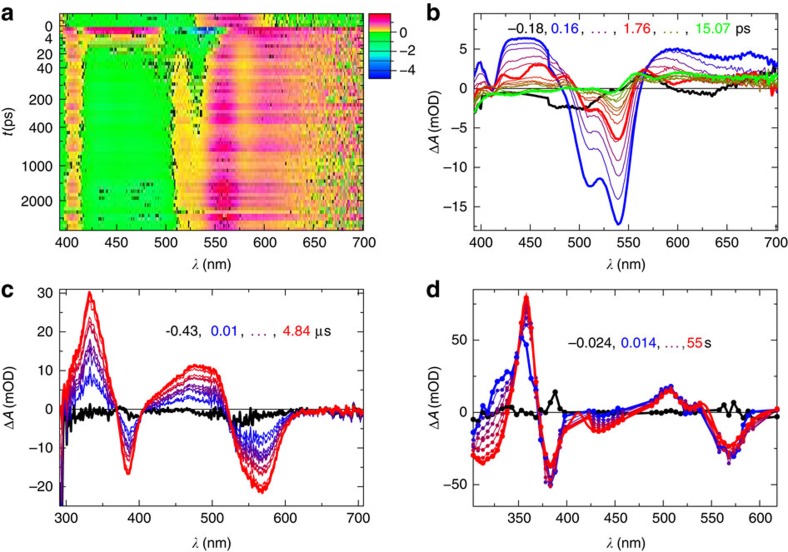
Figure 3. The transient photoresponse of CarH.
(a) False colour plot of the raw data (that is, uncorrected for background data) transient absorption difference spectra that represent the photodynamics of CarH <3 ns (yellow to red, positive amplitudes; green to blue, negative amplitudes). (b) Examples of raw data transient absorption difference spectra recorded using an ultrafast pump–probe spectrometer up to 15 ps following the photoexcitation of CarH by a fs-pulsed laser. (c) Examples of raw data transient absorption difference spectra recorded using a streak camera up to 5 μs following the photoexcitation of CarH by a ns-pulsed laser. (d) Examples of raw data transient absorption difference spectra recorded using an ultraviolet–visible spectrometer up to 55 s following the photoexcitation of CarH by a ms-pulsed LED. (b–d) Black lines represent background data, blue lines the early time data and red lines later time data; the green line in (b) represents the contribution of the component that lives from 15 ps to beyond the data acquisition window (that is, ≫3 ns).

