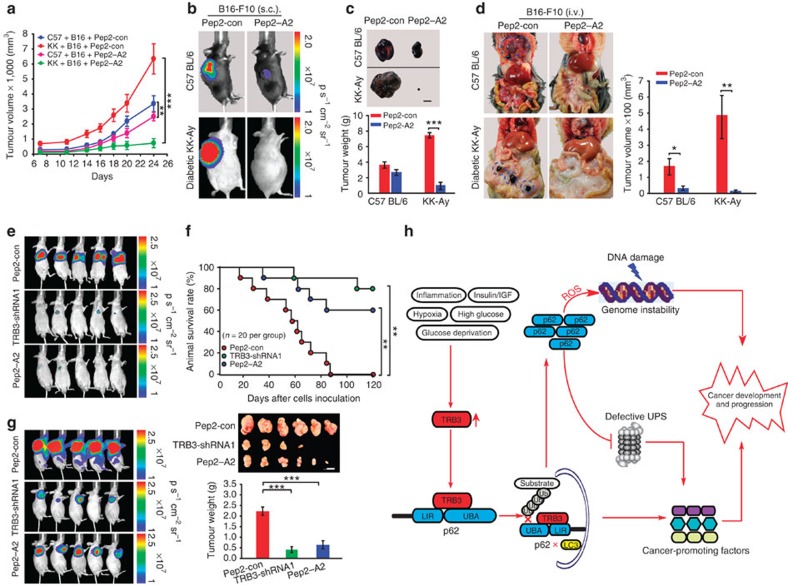
Figure 9. Interrupting the TRB3/p62 interaction inhibits tumour development and progression.
(a–c) Pep2–A2 treatment inhibits tumour growth. KK-Ay and C57 BL/6 mice were s.c. inoculated with B16-F10 cells (1.5 × 10⁵). The animals were treated with Pep2–A2 or Pep2-con (5 mg kg−1) for indicated times. Data are tumour growth curves with mean volumes±s.e.m. at indicated times (a) representative graphs of mice (b) and tumours/quantified tumour weight (c; n=8 per group). Scale bar, 1 cm. (d) Pep2–A2 treatment inhibits metastasis. KK-Ay and C57 BL/6 mice were i.v. injected with B16-F10 cells (3 × 10⁵) and treated with Pep2-con or Pep2–A2 (n=11 per group). Data are representative graphs of animals (left) and total tumour volumes (mean±s.e.m.) at multiple metastatic sites (right). (e–g) Pep2–A2 treatment induces a similar antitumour efficacy with TRB3 silence. BALB/c nude mice were i.v. (3 × 10⁶) or s.c. (1 × 10⁶) injected with HepG2 cells or HepG2 cells expressing TRB3-shRNA1. One week later, the mice injected with the HepG2 cells were treated with Pep2-con or Pep2–A2 (5 mg kg−1) twice a week for 5 weeks. Data are representative of bioluminescence imaging (n=8 per group) (e) Kaplan–Meier survival curves for indicated groups of mice (n=20 per group; statistical significance determined with Kaplan–Meier log-rank test) and (f) photographs of representative mice (n=8 per group). Scale bar, 1 cm. (g). Statistical significance was determined with Student's t-test; *P<0.05, **P<0.01, ***P<0.001. (h) Schematic diagram illustrates the role of TRB3 in metabolic stresses induced cancer development and progression.

