
Fig. 6.
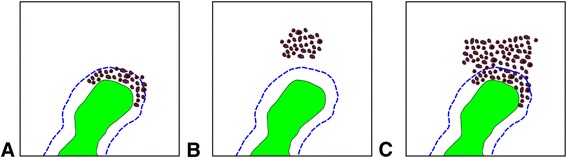
Sketches of different bone marrow infiltration by a lymphoma. Sketch based on the region shown in Fig. 3 to visualize different patterns of bone marrow infiltration. The bone trabeculae are drawn in green. The blue dashed line delineates a region with a maximal sagittal distance of approximately 20 μm around the bone that is regarded as the location of the periosteal niche (compare [50]). Histogram intersection is calculated for direct and indirect interaction (RBFdirect and RBFindirect). a Nodular, peritrabecular infiltration (intersection 0.81 ± 0.05 for direct and 0.88 ± 0.03 for indirect interaction). b Nodular, non-peritrabecular infiltration (intersection 0.51 ± 0.05 for direct and 0.77 ± 0.02 for indirect interaction). c Diffuse bone marrow infiltration (intersection 0.66 ± 0.013 for direct and 0.82 ± 0.05 for indirect interaction)