
Fig. 1.
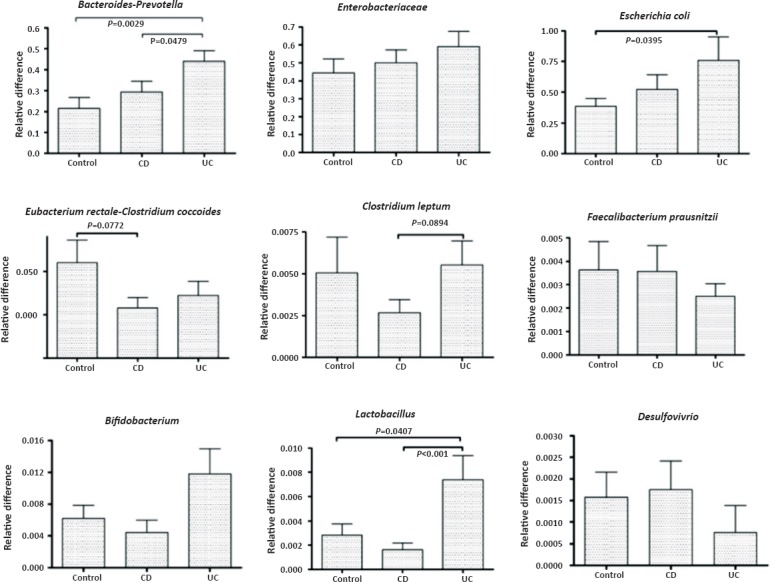
Quantitative representation of the various mucosa-associated bacterial populations in controls, patients with Crohn's disease (CD) and patients with ulcerative colitis (UC). The bars represent mean ± SEM of the relative difference which is the fold amplification of sequences for the target population relative to amplification of universal bacterial domain sequences. significant differences (ANOVA with post-hoc Dunnett's test) are shown.