Fig. 2.

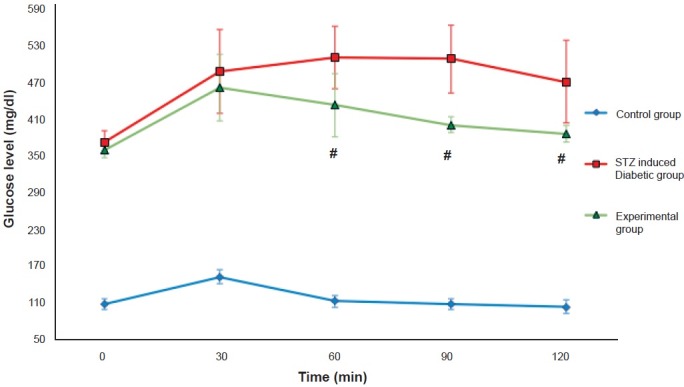
Glucose profile after intraperitoneal glucose tolerance test (IPGTT) in different study groups at the end of the study. Values are mean ± SD (n=6). #P<0.001 compared with STZ induced diabetic group.

Glucose profile after intraperitoneal glucose tolerance test (IPGTT) in different study groups at the end of the study. Values are mean ± SD (n=6). #P<0.001 compared with STZ induced diabetic group.