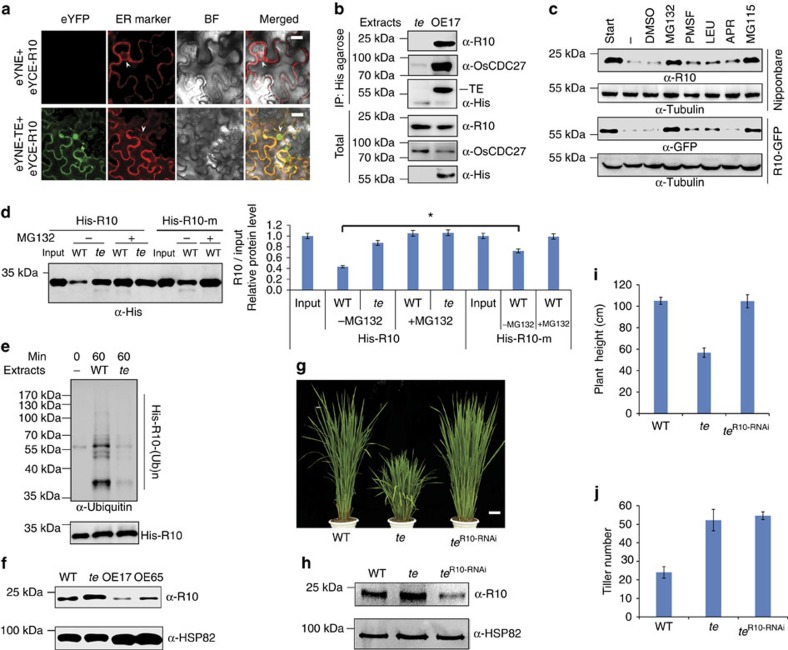
Figure 2. TE mediates the degradation of OsPYL/RCAR10 (R10).
(a) BiFC analysis shows interaction between TE and R10 in N. benthamiana leaf epidermis cells. eYFP, eYFP fluorescence; ER marker, a fluorescent marker protein localized to the endoplasmic reticulum; BF, blight-field image. White arrowheads indicate the nuclear membrane. Scale bar, 50 μm. (b) Co-immunoprecipitation assay shows His-agarose simultaneously pulled down TE, OsCDC27 and R10 from the OE17, but not te, plant extracts by specifically binding the His epitope at the TE N-terminus. (c) Cell-free degradation assay shows that the degradation of R10 in WT (cv. Nipponbare) or R10-GFP in the R10-GFP overexpression line is effectively blocked by MG132 or MG115 but not by PMSF, LEU, APR or DMSO. (d) Cell-free degradation assay shows that the mutant His-R10-m protein with a mutated D-box (RLDL→ALDA) remains relatively stable compared with His-R10 WT protein in WT plant extracts. ‘Input' shows that roughly equal amounts of His-R10-m and His-R10 proteins were used. Left panel shows the representative western blot and the right panel shows the quantification analysis of relative R10/input protein levels corresponding to the left panel. Error bars represent the s.d. from triplicate experiments. Asterisks mark significant differences in relative R10/input protein levels between His-R10 and His-R10-m in WT plant extracts without MG132 treatment according to the Student's t-test (*P<0.05). (e) In vitro ubiquitination assay shows that His-R10 is polyubiquitinated more effectively by the WT than by the te plant extracts. (f) Western blot analysis shows that the levels of R10 protein in WT, te, OE17 and OE65 seeds. (g) The phenotype of the R10 RNAi line in the te background. Scale bar, 10 cm. (h) Western blot analysis shows that the level of R10 protein is reduced in the teR10-RNAi plants compared with te. (i) Heights of 3-month-old WT, te and teR10-RNAi plants. (j) The tiller number of 3-month-old WT, te and teR10-RNAi plants. Values are means±s.d. in i and j (n=30 seedlings). ‘α-Tubulin' in c or ‘α-HSP82'in f and h indicate that roughly equal amounts of total plant extracts were used.

