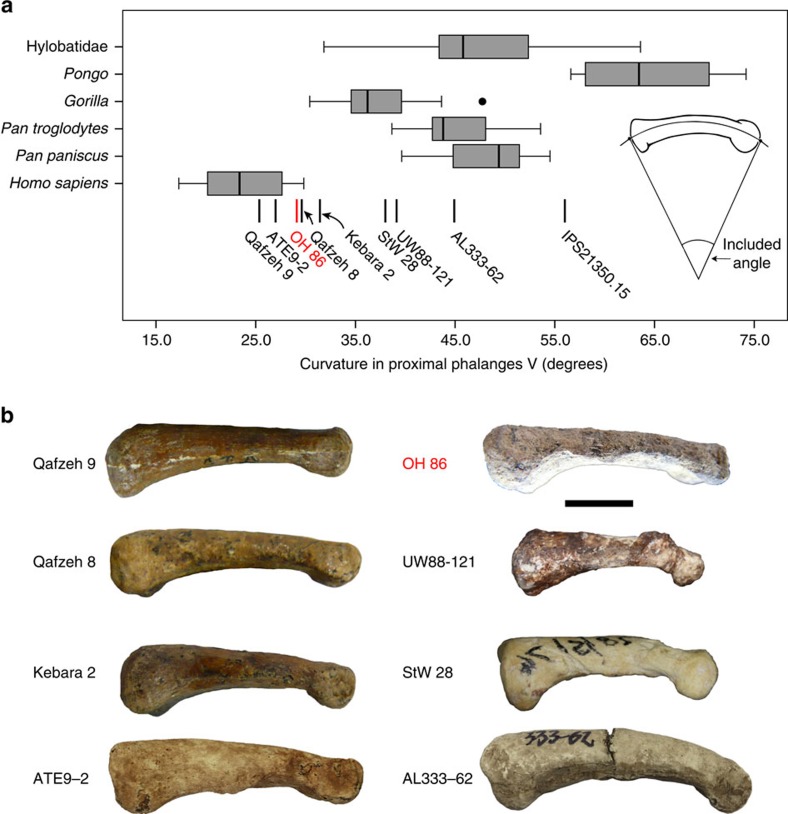
Figure 4. Phalangeal curvature in extant and fossil hominoids.
(a) Included angle values (in degrees) in a modern and fossil sample of fifth proximal phalanges. OH 86 is (exclusively) within the modern human variation (distinct from australopiths). Boxes represent 25th and 75th percentiles, centreline is the median, whiskers represent non-outlier range and the dot is an outlier. Samples for each boxplot are Homo sapiens (n=36), Pan paniscus (n=8), Pan troglodytes (n=16), Gorilla (n=22), Pongo (n=16) and Hylobatidae (n=22). (b) The fossil hominin specimens analysed in this study are compared in lateral view. All pictures were taken from the originals with the exception of AL333-62 (cast) and ATE9-2 (modified from the literature56; Supplementary Table 4). Scale bar, 1 cm.

