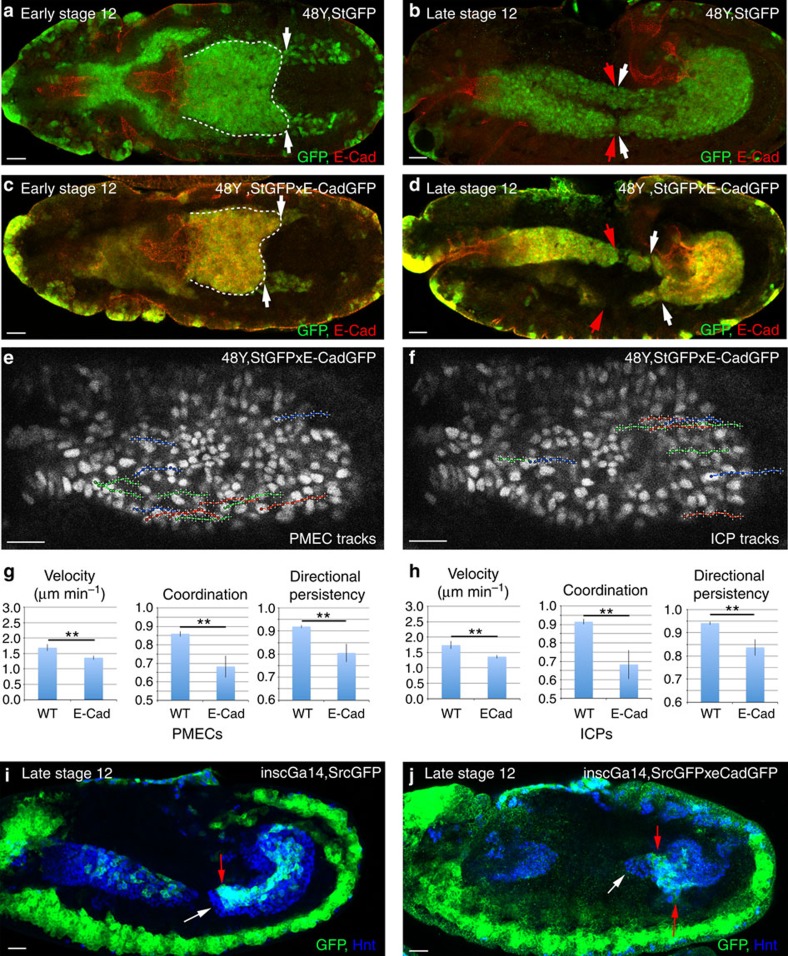
Figure 3. Overexpression of E-Cad delays the migration of both PMECs and ICPs.
(a–d) Early stage 12 (a,c) and late stage 12 (b,d) embryos, with 48Y-Gal4 driving expression of either StGFP alone (a,b) or together with E-Cad-GFP (c,d). (a,c) Dashed lines delineate the PMG, whose bilateral symmetry is lost in c. (b,d) In wild-type (WT) embryos, the anterior midgut (red arrows) and PMG (white arrows) have met (b), while this is delayed by increased E-Cad levels (d). (e,f) Representative tracks of the paths taken by PMECs (e) and ICPs (f) with increased levels of E-Cad. (g,h) Velocity, coordination and directional persistence values calculated from movies of WT and E-Cad overexpressing PMGs. Data are presented as mean ±s.e.m. *P<0.05; **P<0.01; by paired t-test, n=6 for each condition (see Supplementary Table 1 for raw data). (i,j) Late stage 12 embryos, with the ICP-specific Gal4, inscG4, driving expression of either srcGFP alone (i) or srcGFP and E-Cad-GFP (j). White arrow indicates the migration front of PMECs, and red arrow of the ICPs. Scale bar, 20 μm.

