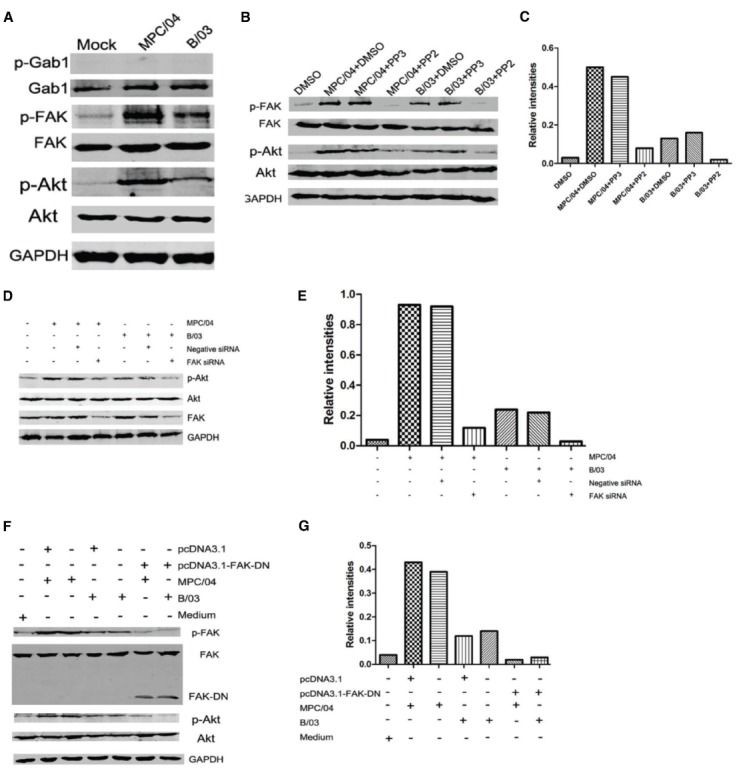
FIGURE 5.

Dependence of PI3K/Akt activation on FAK phosphorylation. (A) Serum-starved A549 cells were infected with MPC/04 and B/03 at a MOI of 5 or mock-infected for 30 min. The cell lysates were collected, and the expression of Gab1, phosphorylated Gab1 (Tyr627; p-Gab1), FAK, phosphorylated FAK (Tyr397; p-FAK), p-Akt (Ser473), total Akt and GAPDH was determined by Western blot analysis. (B) Serum-starved A549 cells were pretreated with 10 μM PP2 or PP3 (as control) for 60 min and then infected with MPC/04 and B/03 at a MOI of 10 or mock-infected for 30 min. The cell lysates were collected, and the expression of p-FAK, FAK, p-Akt (Ser473), Akt and GAPDH was determined as for A. (D) A549 cells were transfected with 15 pmol/well of negative control (Negative siRNA) or FAK siRNA. 24 h after transfection, cells were infected with MPC/04 or B/03 at a MOI of 5. After 30 min, the cell lysates were collected, and the levels of p-Akt (Ser473), total Akt, FAK and GAPDH were determined by Western blot analysis. (F) A549 cells were transfected with 2 μg/well of pcDNA3.1, pcDNA3.1-FAK-DN or medium for 24 h, and the cells were then infected with MPC/04 and B/03 at a MOI of 5 or mock-infected for 30 min. The p-FAK, FAK, p-Akt (Ser473), Akt and GAPDH levels were determined as for (A). The results shown in (A–C) were confirmed in three independent experiments. (E,G) Quantification of relative p-Akt band intensities to Akt in (E) and (G). The results were confirmed in three independent experiments.
