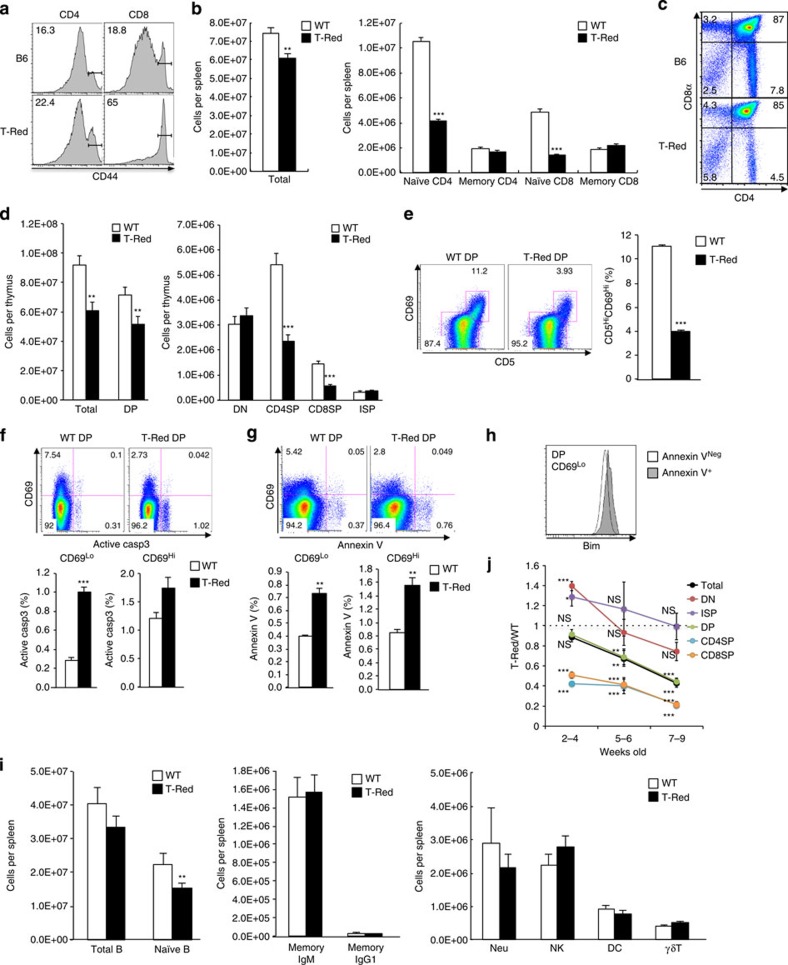
Figure 1. Establishment of a mutant mouse strain having excess memory T cells.
(a) T-cell phenotypes in a mutant strain induced by ENU treatment (T-Red) and control (B6) mice. Flow cytometry analysis was performed using peripheral blood from the mutant strain (9 weeks old). Indicated numbers are percentages of memory/activated phenotype T cells, as monitored by CD44 expression. (b) Number of T cells harvested from the spleen. Mice up to 12 weeks old were used. (c) CD4 and CD8 plots of the thymus at 6 weeks old. (d) Number of thymocytes harvested from the thymus. DP, CD4+CD8+ population; DN (double-negative), CD4-CD8- population; CD4SP (CD4 SP), CD3highCD4+CD8- population; CD8SP (CD8 SP), CD3highCD4-CD8+ population; and ISP (immature SP), CD3 lowCD4-CD8+ population. Mice up to 12 weeks old were used. (e) CD5 and CD69 levels in CD4+CD8+ DP population (left) and the frequency of CD5HiCD69Hi DP populations (right). Mice at 6–8 weeks old were used. (f,g) The frequencies of active caspase 3 (casp3) (f) and annexin V (g) in DP thymocytes. (h) Bim levels of annexin V-negative (Neg) or positive (+) DP CD69Lo thymocytes. (i) Cell numbers of other cell types in the spleen: B (CD19+) cells, naïve B (CD19+IgM+CD273-) cells, memory IgM (CD19+IgM+CD273+) cells, memory IgG1 (CD19+IgG1+CD273+) cells, natural killer cells (NK), γδT cells (γδT), neutrophils (Neu) and dendritic cells (DC). Mice up to 12 weeks old were used. (j) Time course of changes in thymic cellularity. The ratio (T-Red/WT) of each thymic population (cell number) is shown. Data represent the mean+s.e.m. (b, n>40; d, n>30; e–g, n=4–6 mice; i, n=8–20; and j, n=6–14 for each time point). Representative FACS plots from more than three independent experiments are shown (c,e–h). P values are shown or indicated by asterisks (*P<0.05, **P<0.01 and ***P<0.001); NS, not significant.

