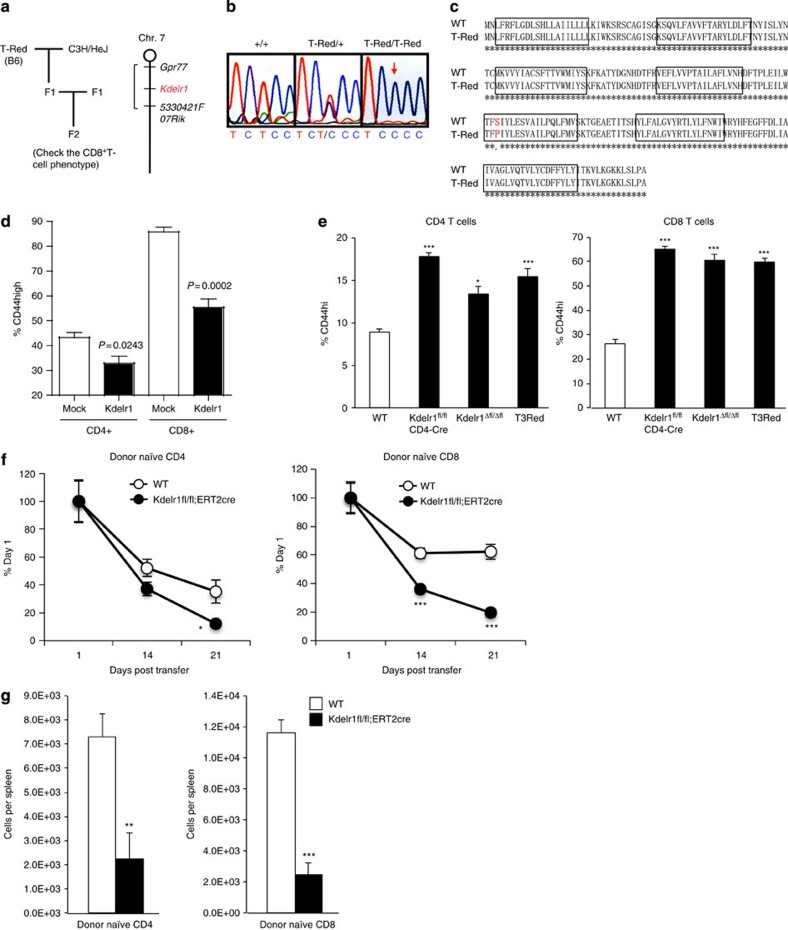
Figure 2. A point mutation in the Kdelr1 gene is responsible for the T-Red T-cell phenotype.
(a) Scheme of the gene mapping (left). The chromosomal location of the gene responsible for T-Red was mapped in an ∼100 kb region between the Gpr77 and 5330421F07Rik genes of chromosome 7 (right). (b) Resequencing mRNA and genomic DNA exons revealed a single T→C nucleotide substitution in the Kdelr1 gene mouse homologue. (c) This mutation resulted in a Ser123→Pro amino-acid substitution in the fifth transmembrane domain. Boxes represent presumptive transmembrane domains. (d) Flow cytometry analysis of CD4+ and CD8+ T-cell phenotypes 2 months after retrovirus-mediated forced expression of WT KDELR1 (Kdelr1) or control vector (mock) in T-Red mouse derived haematopoietic stem cells transplanted into the bone marrow (5–6 weeks old). Percentages of CD44 high populations of T cells are shown. Data represent the mean+s.e.m. (n=3–4). (e) Flow cytometery analysis in T cells was performed using peripheral blood from T-Red, CD4-cre/ Kdelr1flox/flox, CAG-Cre/ Kdelr1flox/flox (Kdelr1Δfl/Δfl) and control mice (7–14 weeks old). Percentages of CD44 high populations of T cells in peripheral blood are shown. Data represent the mean+s.e.m. (n=6–23). One-way ANOVA with post hoc Dunnett's test was used. (f) The percentages in peripheral blood (% of day 1) of donor naïve CD4 or CD8 T cells from WT and Kdelr1flox/flox;ERT2cre (8–11 weeks old) mice. The cells were mixed 1:1 on transfer. The host mice were treated with tamoxyfen to induce Kdelr1 deficiency after transfer. (g) The absolute numbers of donor cells in the spleen of the mice in f on day 21. Data represent the mean+s.e.m. (n=6). P values are shown or indicated by asterisks (*P<0.05, **P<0.01 and ***P<0.001).

