Fig. 5.

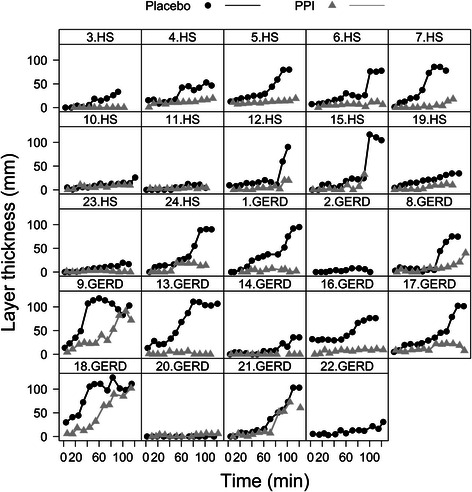
Formation of individual secretion layers. Layer thickness over time is depicted for all healthy subjects (HS) and GERD patients under placebo (black dots/lines) and PPI therapy (grey triangles/lines)

Formation of individual secretion layers. Layer thickness over time is depicted for all healthy subjects (HS) and GERD patients under placebo (black dots/lines) and PPI therapy (grey triangles/lines)