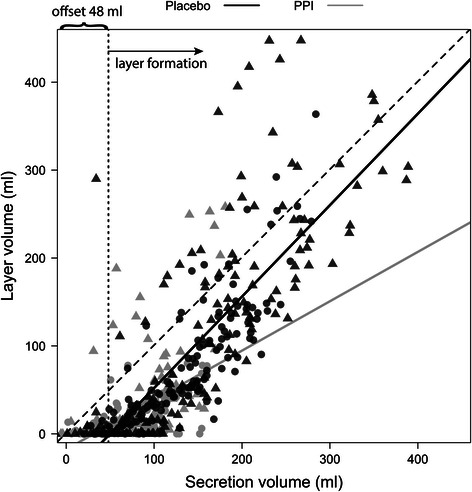
Fig. 6.

Correlation of layer and secretion volume under placebo and PPI therapy. GERD and HS data are depicted as triangles and circles, respectively; placebo volumes (black), PPI volumes (grey). The offset in the correlation indicates that layer formation started when approximately 50 ml secretion was present in the stomach. For placebo, the regression coefficient was R2 = 0.7 with regression slope and offset of 1.04 ± 0.04 and -52 ± 7 ml, respectively. On pantoprazole therapy, the regression coefficient was reduced to R2 = 0.3 with regression slope and offset of 0.56 ± 0.06 and offset -18 ± 5, respectively
