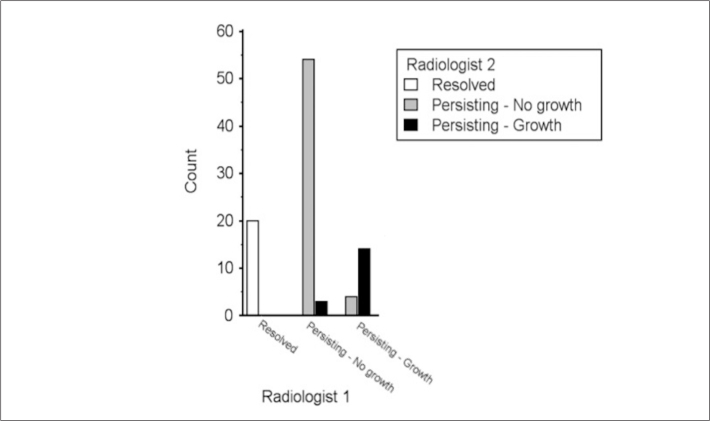
Figure 6.
Differences in classification of nodule evolution. The graph shows pure ground-glass nodule (pGGN) classification by both radiologists: classification by radiologist 1 is displayed on the x-axis as the sum of the two bars; classification of radiologist 2 is displayed on the x-axis by specific bar colors (legend in right-upper corner box). No difference was seen in classification of resolved pGGN. The evolution of seven persisting nodules was different between the two radiologists: radiologist 1 classified as “no growth” a total of 57 persisting pGGNs, of which three were classified as “growth” by radiologist 2; radiologist 1 classified as “growth” a total of 18 persisting pGGNs, of which four were classified as “no growth” by radiologist 2.

