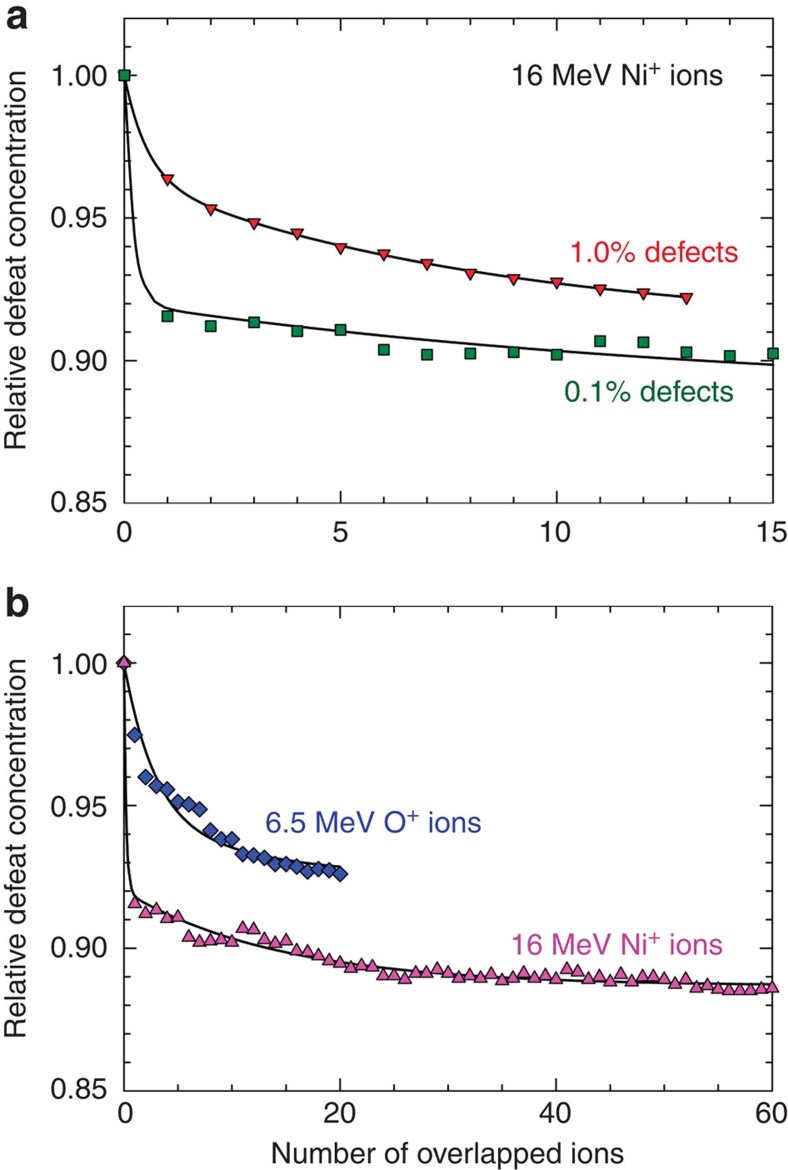
Figure 3. Molecular dynamics simulation of ionization-induced healing.
Decrease of the relative defect concentration is shown as a function of overlap ions: (a) 16 MeV Ni ions in a simulation cell with initial disorder levels of 1.0 and 0.1% and (b) 6.5 MeV O ions and 16 MeV Ni ions in a simulation cell containing 0.1 % Frenkel pairs, respectively. The initial damage state is marked as (0) before the first (1) ion. The statistical error is represented by the scattered data points from the fitted lines.

